Emission Management → Results
The Results section is the conclusive analytical stage of the Emission Management workflow — where all validated and calculated emissions data converge into a structured, transparent view. This module transforms raw entries and matched factors into final, auditable carbon footprint results, ready for internal analysis, benchmarking, and reporting.
Written By CarbonX Registry
Last updated 9 months ago
By consolidating outputs across Scopes 1, 2, and 3, the Results page provides sustainability teams with both a big-picture view of organizational emissions and granular traceability at the activity level. Every result can be traced back to its source file, facility, emission factor, and calculation method, ensuring full accountability and compliance with GHG Protocol reporting standards.
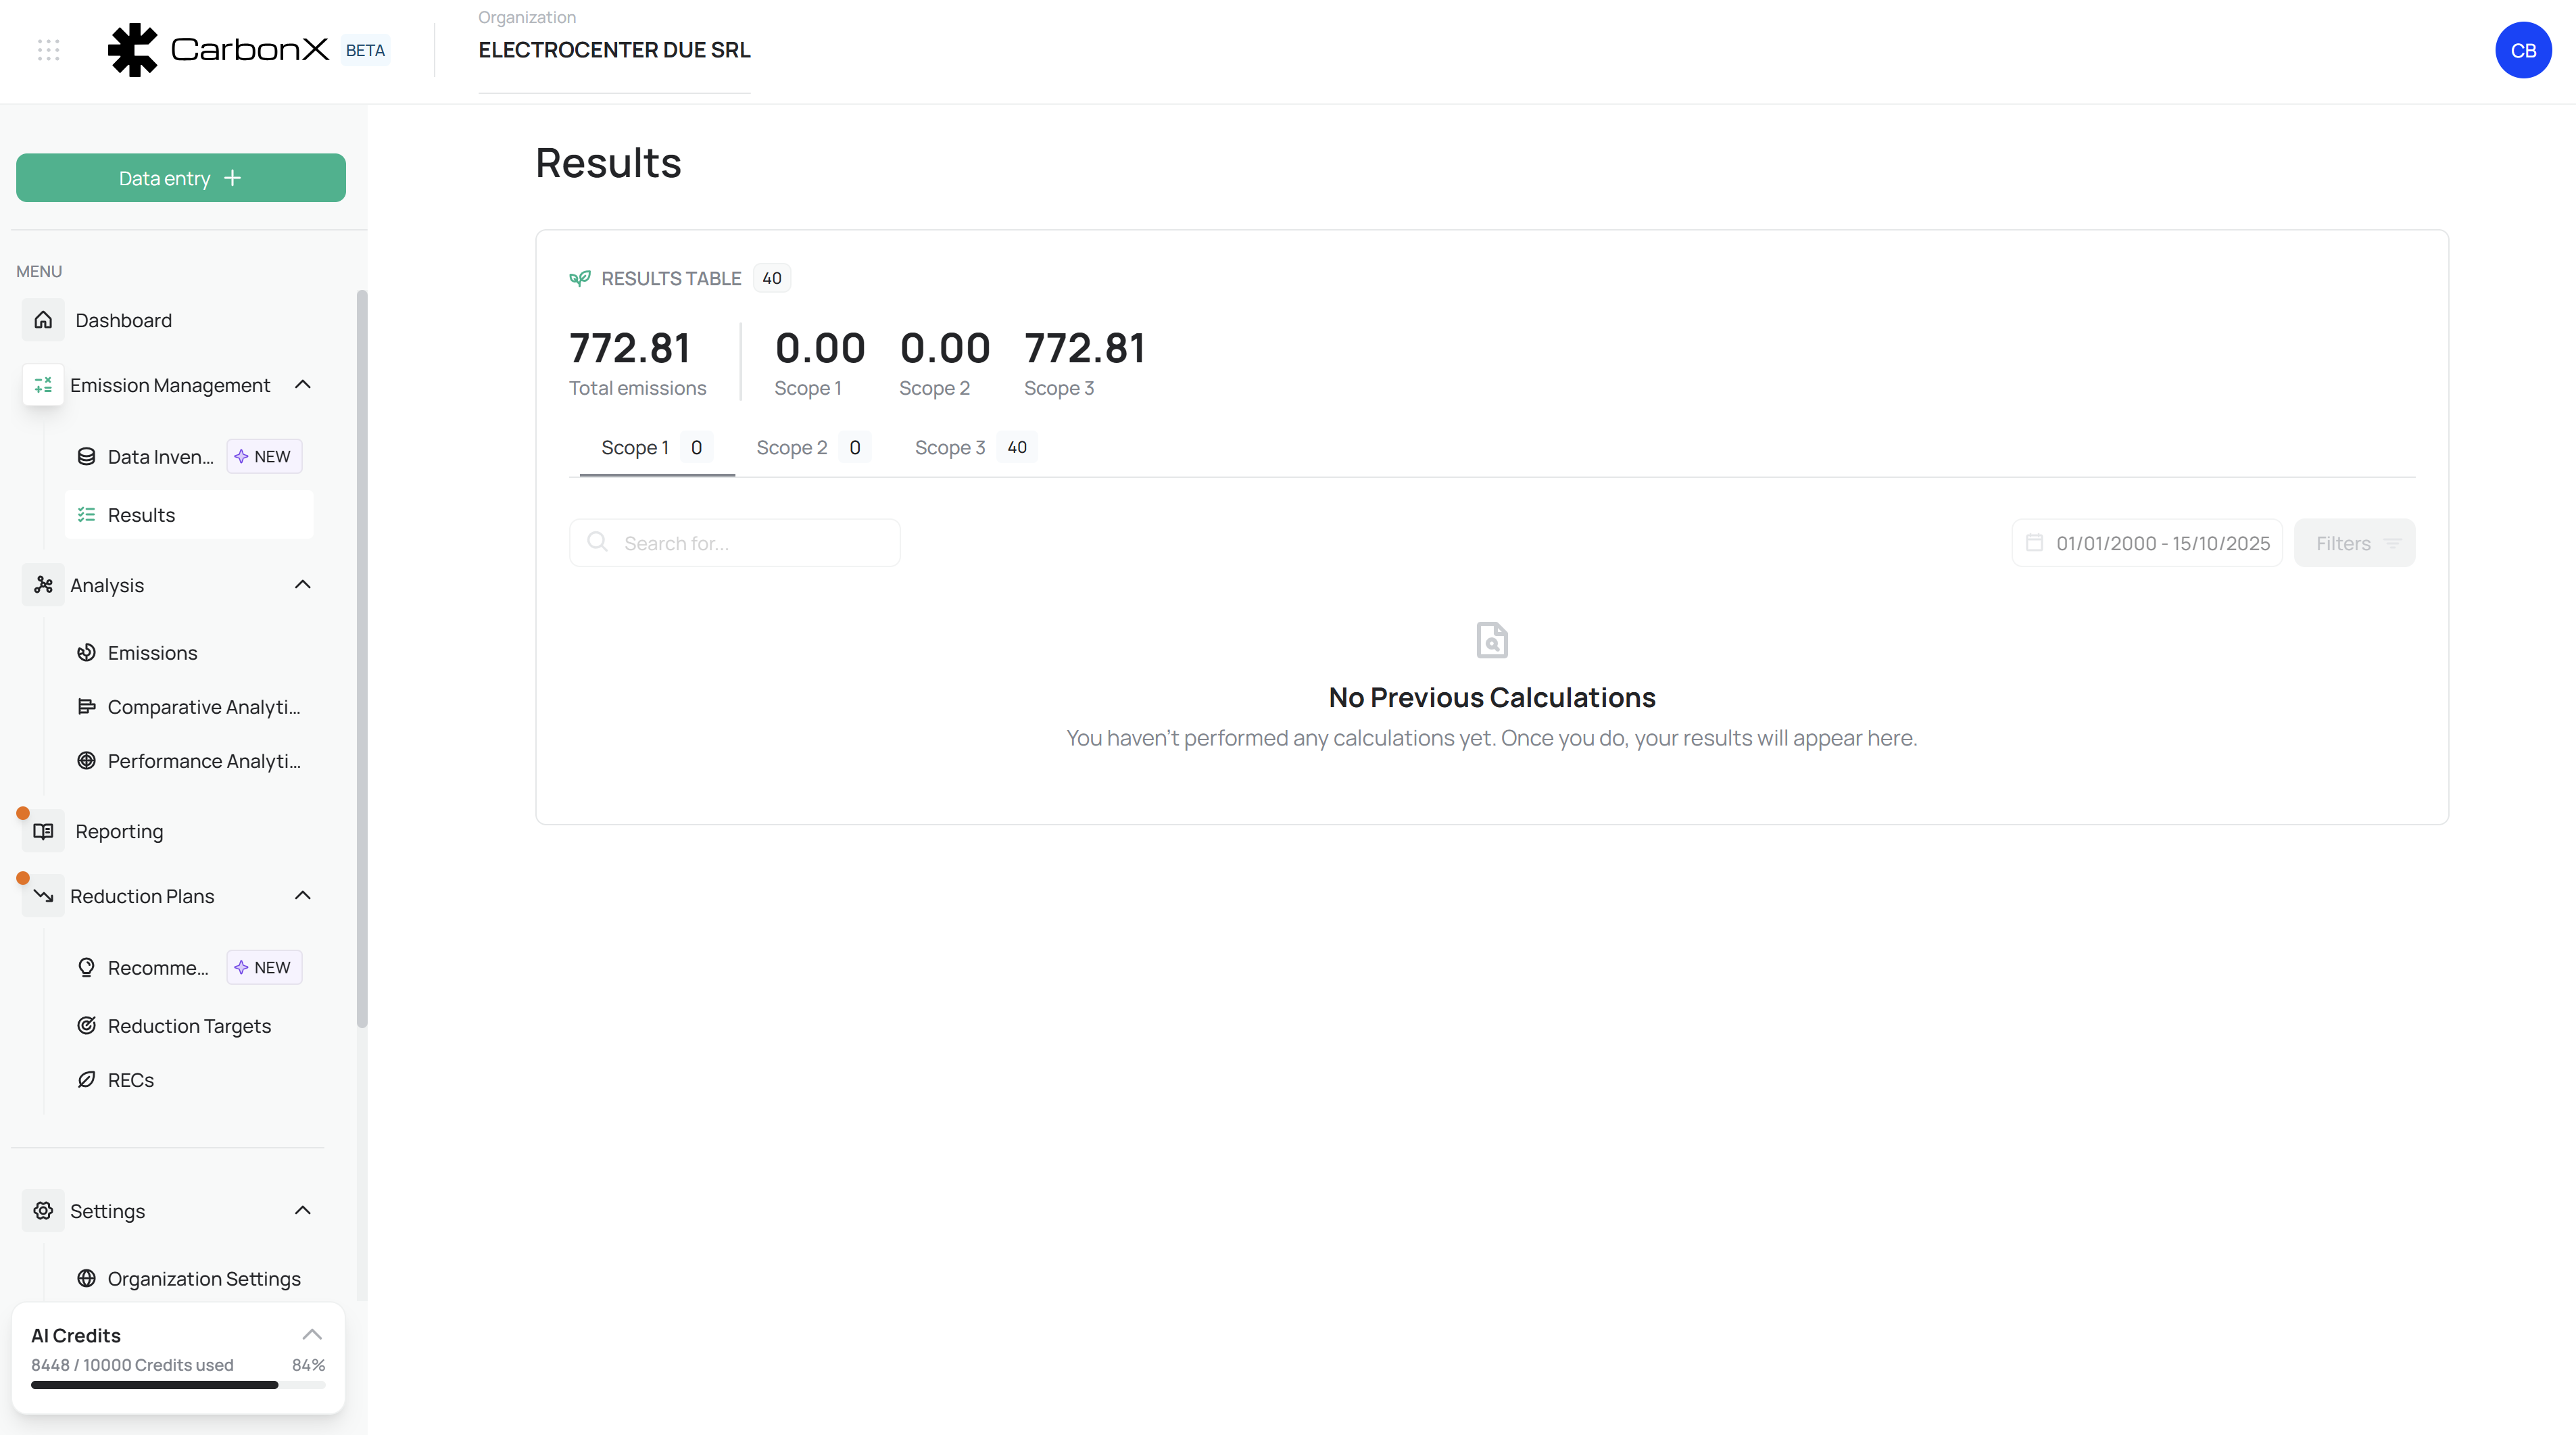
Image: Results interface displaying total and scope-based emissions, expandable categories, emission factor references, and quality tier indicators for full traceability.
1. Overview Panel
The Overview Panel at the top of the Results interface serves as a live summary dashboard of your organization’s total calculated emissions. It aggregates verified results from all facilities and sources into a comprehensive footprint view.
Core Elements:
Total Emissions (tCO₂e): Displays the organization’s total carbon emissions, aggregated across all scopes and facilities.
Scope Breakdown: Separate metrics for
Scope 1 (Direct emissions) – Onsite fuel combustion, company vehicles, and industrial processes.
Scope 2 (Indirect energy) – Purchased electricity, steam, heat, and cooling.
Scope 3 (Value chain) – Upstream and downstream activities, such as purchased goods, business travel, or waste generation.
Calculated Entry Count: Shows the total number of processed activity records contributing to each scope’s total.
Date-Range Filter: Enables users to quickly select the reporting period — e.g., current year, last fiscal year, or a custom date range.
Historical Comparison Toggle: Allows comparison between reporting periods to monitor emission trends and track reduction progress.
Key Benefit:
This panel provides executives and analysts with immediate insight into emission distribution and year-over-year trends without navigating deeper datasets.
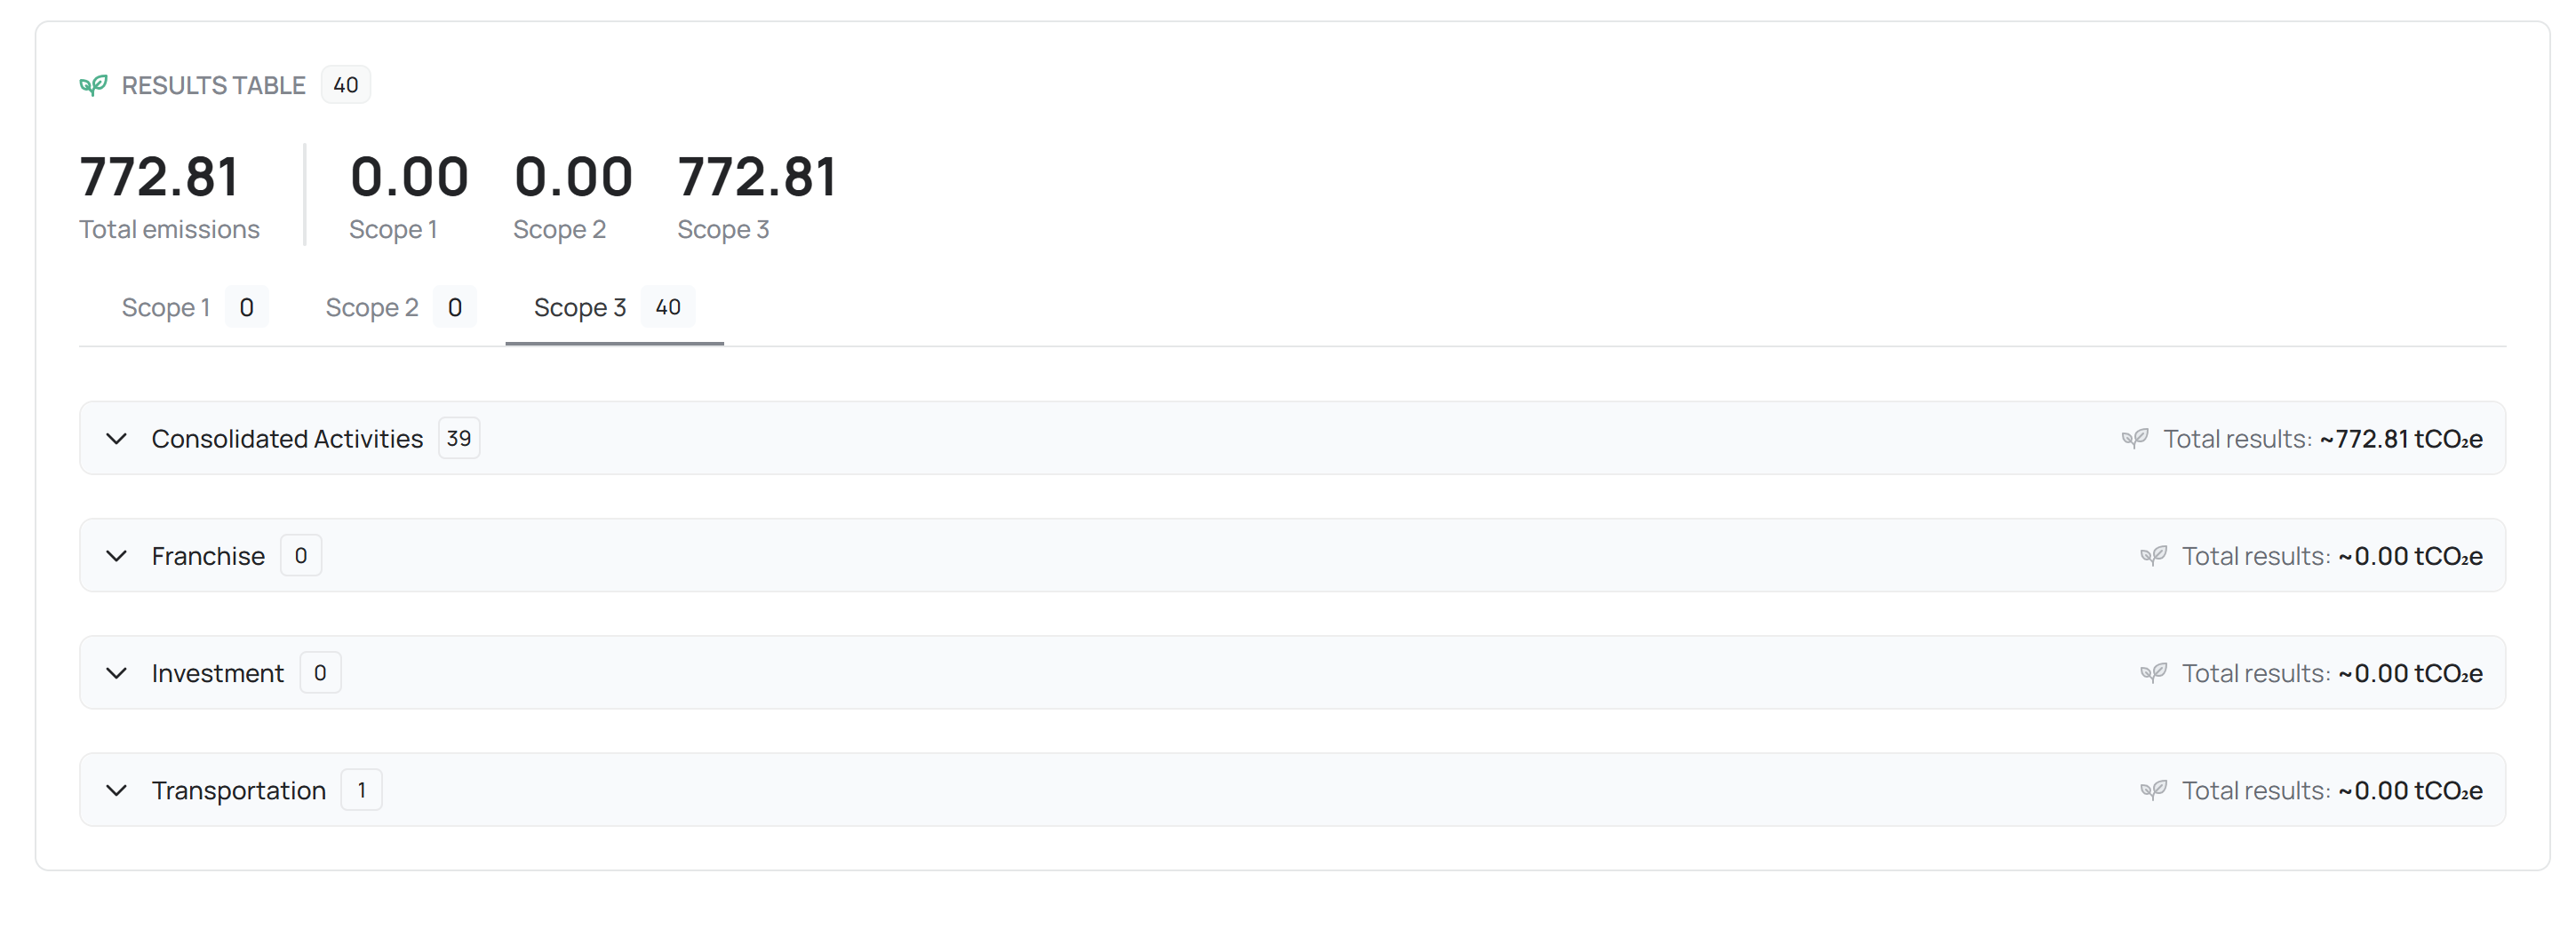
2. Results Table
The Results Table is the analytical core of the module, presenting a hierarchical and expandable view of all calculated emissions data. It structures every emission value by operational category and scope, allowing precise tracing from consolidated totals down to individual activity records.
Main Organizational Levels:
Consolidated Activities – Aggregated totals for all operations, grouped by emission category.
Franchise – Captures indirect emissions associated with franchised operations or subsidiary entities.
Investment – Reflects financial and equity-based emissions contributions.
Transportation – Includes logistics, employee commuting, and business travel emissions.
Each of these categories can be expanded to reveal detailed line items, showing:
Emission Source: The origin of the emission (e.g., electricity use, vehicle fuel consumption, air travel).
Category Name: The GHG classification (e.g., Stationary Combustion, Purchased Goods, Upstream Transportation).
Facility Name: The site or unit responsible for the recorded activity.
Activity Data: Quantitative input used in the calculation (e.g., kWh, liters, tons).
EF Reference: The emission factor used, including version and dataset source (e.g., Defra 2024, EPA 2022, GHG Protocol 2023).
Result Value (tCO₂e): The final calculated carbon equivalent result for the record.
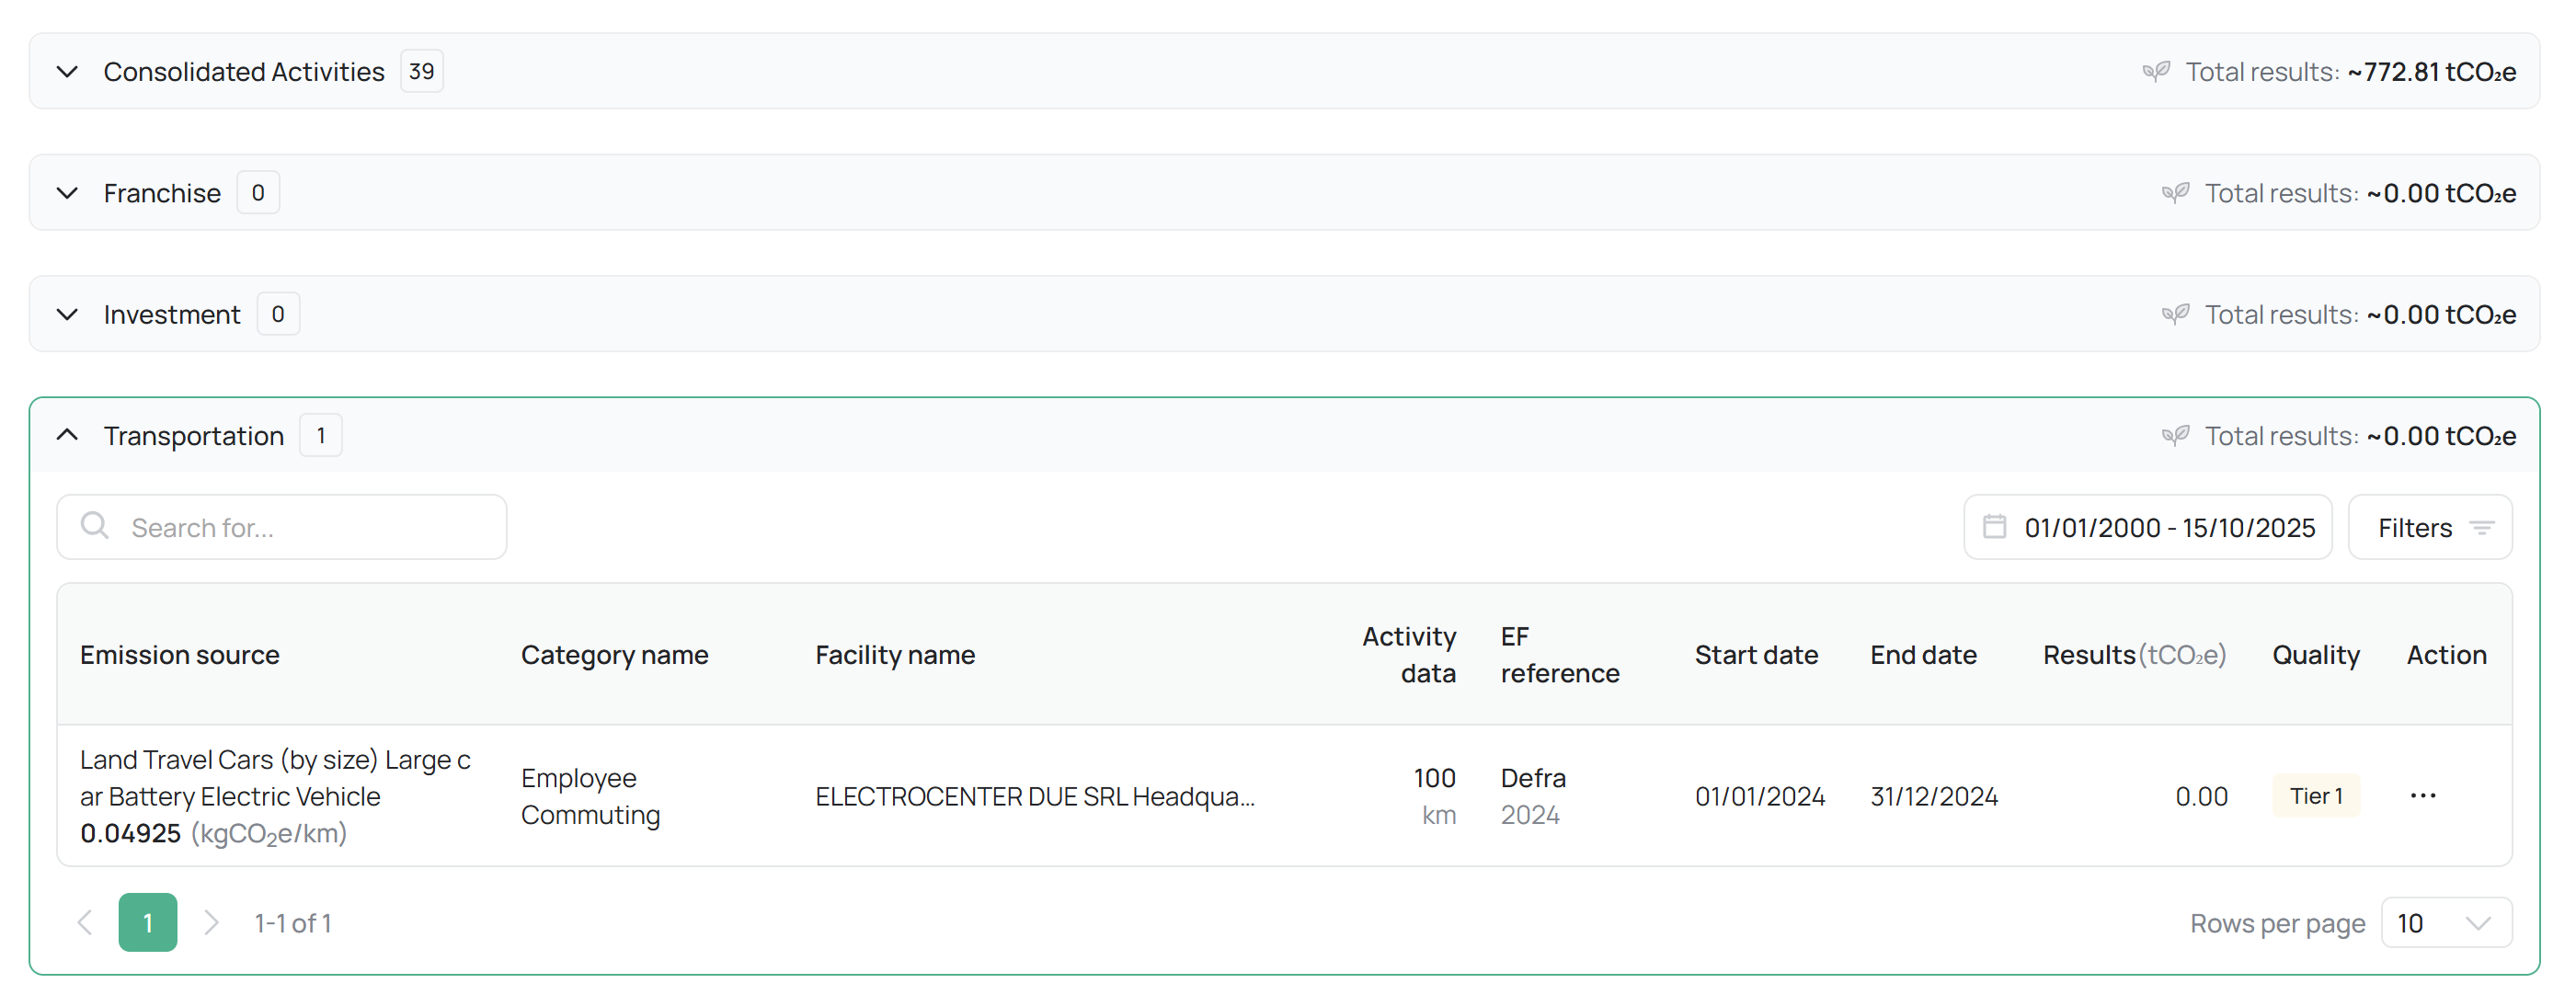
This format ensures that every emission result can be traced back through its full calculation lineage, from source data to emission factor and final output.
3. Additional Functionalities
The Results module integrates several intelligent utilities to improve data analysis, confidence assessment, and audit readiness.
A. Filtering & Search
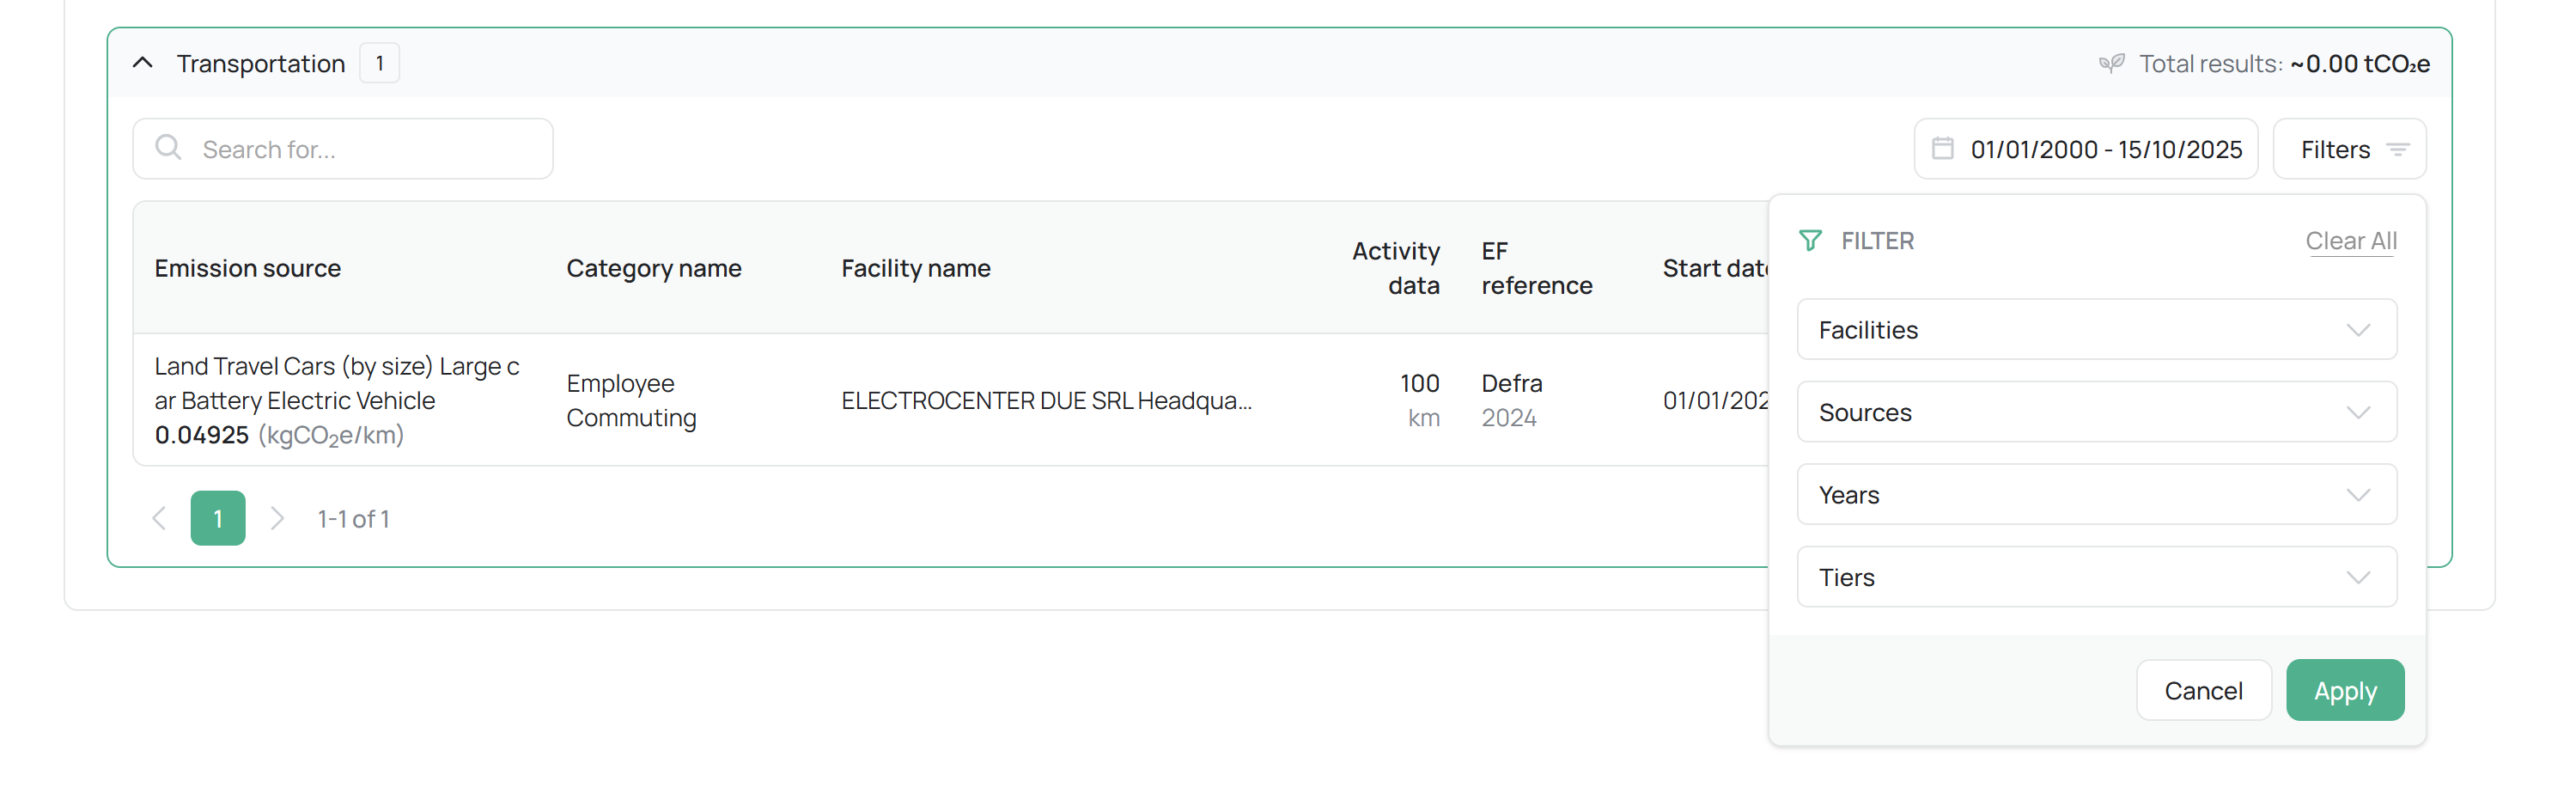
Users can refine the dataset using filters based on:
Facility
Date Range or Reporting Period
Emission Factor Source
Tiers
This ensures efficient navigation across large organizational datasets.
B. Tier Quality Indicators
Each emission record is assigned a Tier Level (1–3), indicating data reliability and methodological confidence:
Tier 1: Default or generalized emission factor (low specificity).
Tier 2: Organization-specific factor or intermediate data accuracy.
Tier 3: Direct measurement or verified high-quality data source (highest confidence).
Tier tagging promotes transparency by helping users and auditors assess the robustness of each calculation.
C. EF References
Every calculated entry includes an Emission Factor Reference, clearly identifying the source database, publication year, and standard.
Examples include:
EPA (2022) – Stationary Combustion Factors
Defra (2024) – Electricity Grid Intensity (EU Average)
IPCC (2021) – Industrial Process Coefficients
This feature guarantees traceability to the original scientific and regulatory source of each factor.
D. Expandable Views
Users can drill down from high-level totals to individual activity records through expandable panels.
This hierarchy supports both strategic overviews (e.g., emissions per category) and operational deep-dives (e.g., activity-level verification for audits).
4. Purpose and Role
The Results section acts as the final validation checkpoint before emissions data transitions into formal reports or reduction planning.
It ensures that every value displayed on dashboards or exported reports can be traced, verified, and justified — fulfilling key compliance requirements for frameworks like GHG Protocol, ISO 14064, and CDP Reporting.
Through its structured views and embedded metadata, the module transforms raw operational data into verified, report-ready insights — the definitive foundation for carbon performance analysis, ESG reporting, and audit submission.
5. Best Practices
Always verify that all three scopes are populated before exporting or generating reports.
Use Tier Quality Indicators to identify where data collection improvements are needed.
Regularly filter by EF Reference to ensure outdated factors are updated before reporting.
Utilize Expandable Views for spot checks during internal audits.
Export summarized and detailed views for submission to verifiers or inclusion in sustainability disclosures.