Analysis → Comparative Analytics
The Comparative Analytics module provides a robust benchmarking environment for analyzing emissions data across facilities and time periods, empowering organizations to measure operational efficiency, evaluate decarbonization performance, and identify regional or temporal trends.
Written By CarbonX Registry
Last updated 9 months ago
It functions as a strategic performance dashboard, connecting the analytical precision of the Emissions page with actionable insights that drive sustainability planning and corporate reporting. Through dynamic filters, visual comparisons, and framework-based analysis, this module helps users understand not just how much carbon they emit — but where and when those emissions occur and evolve.
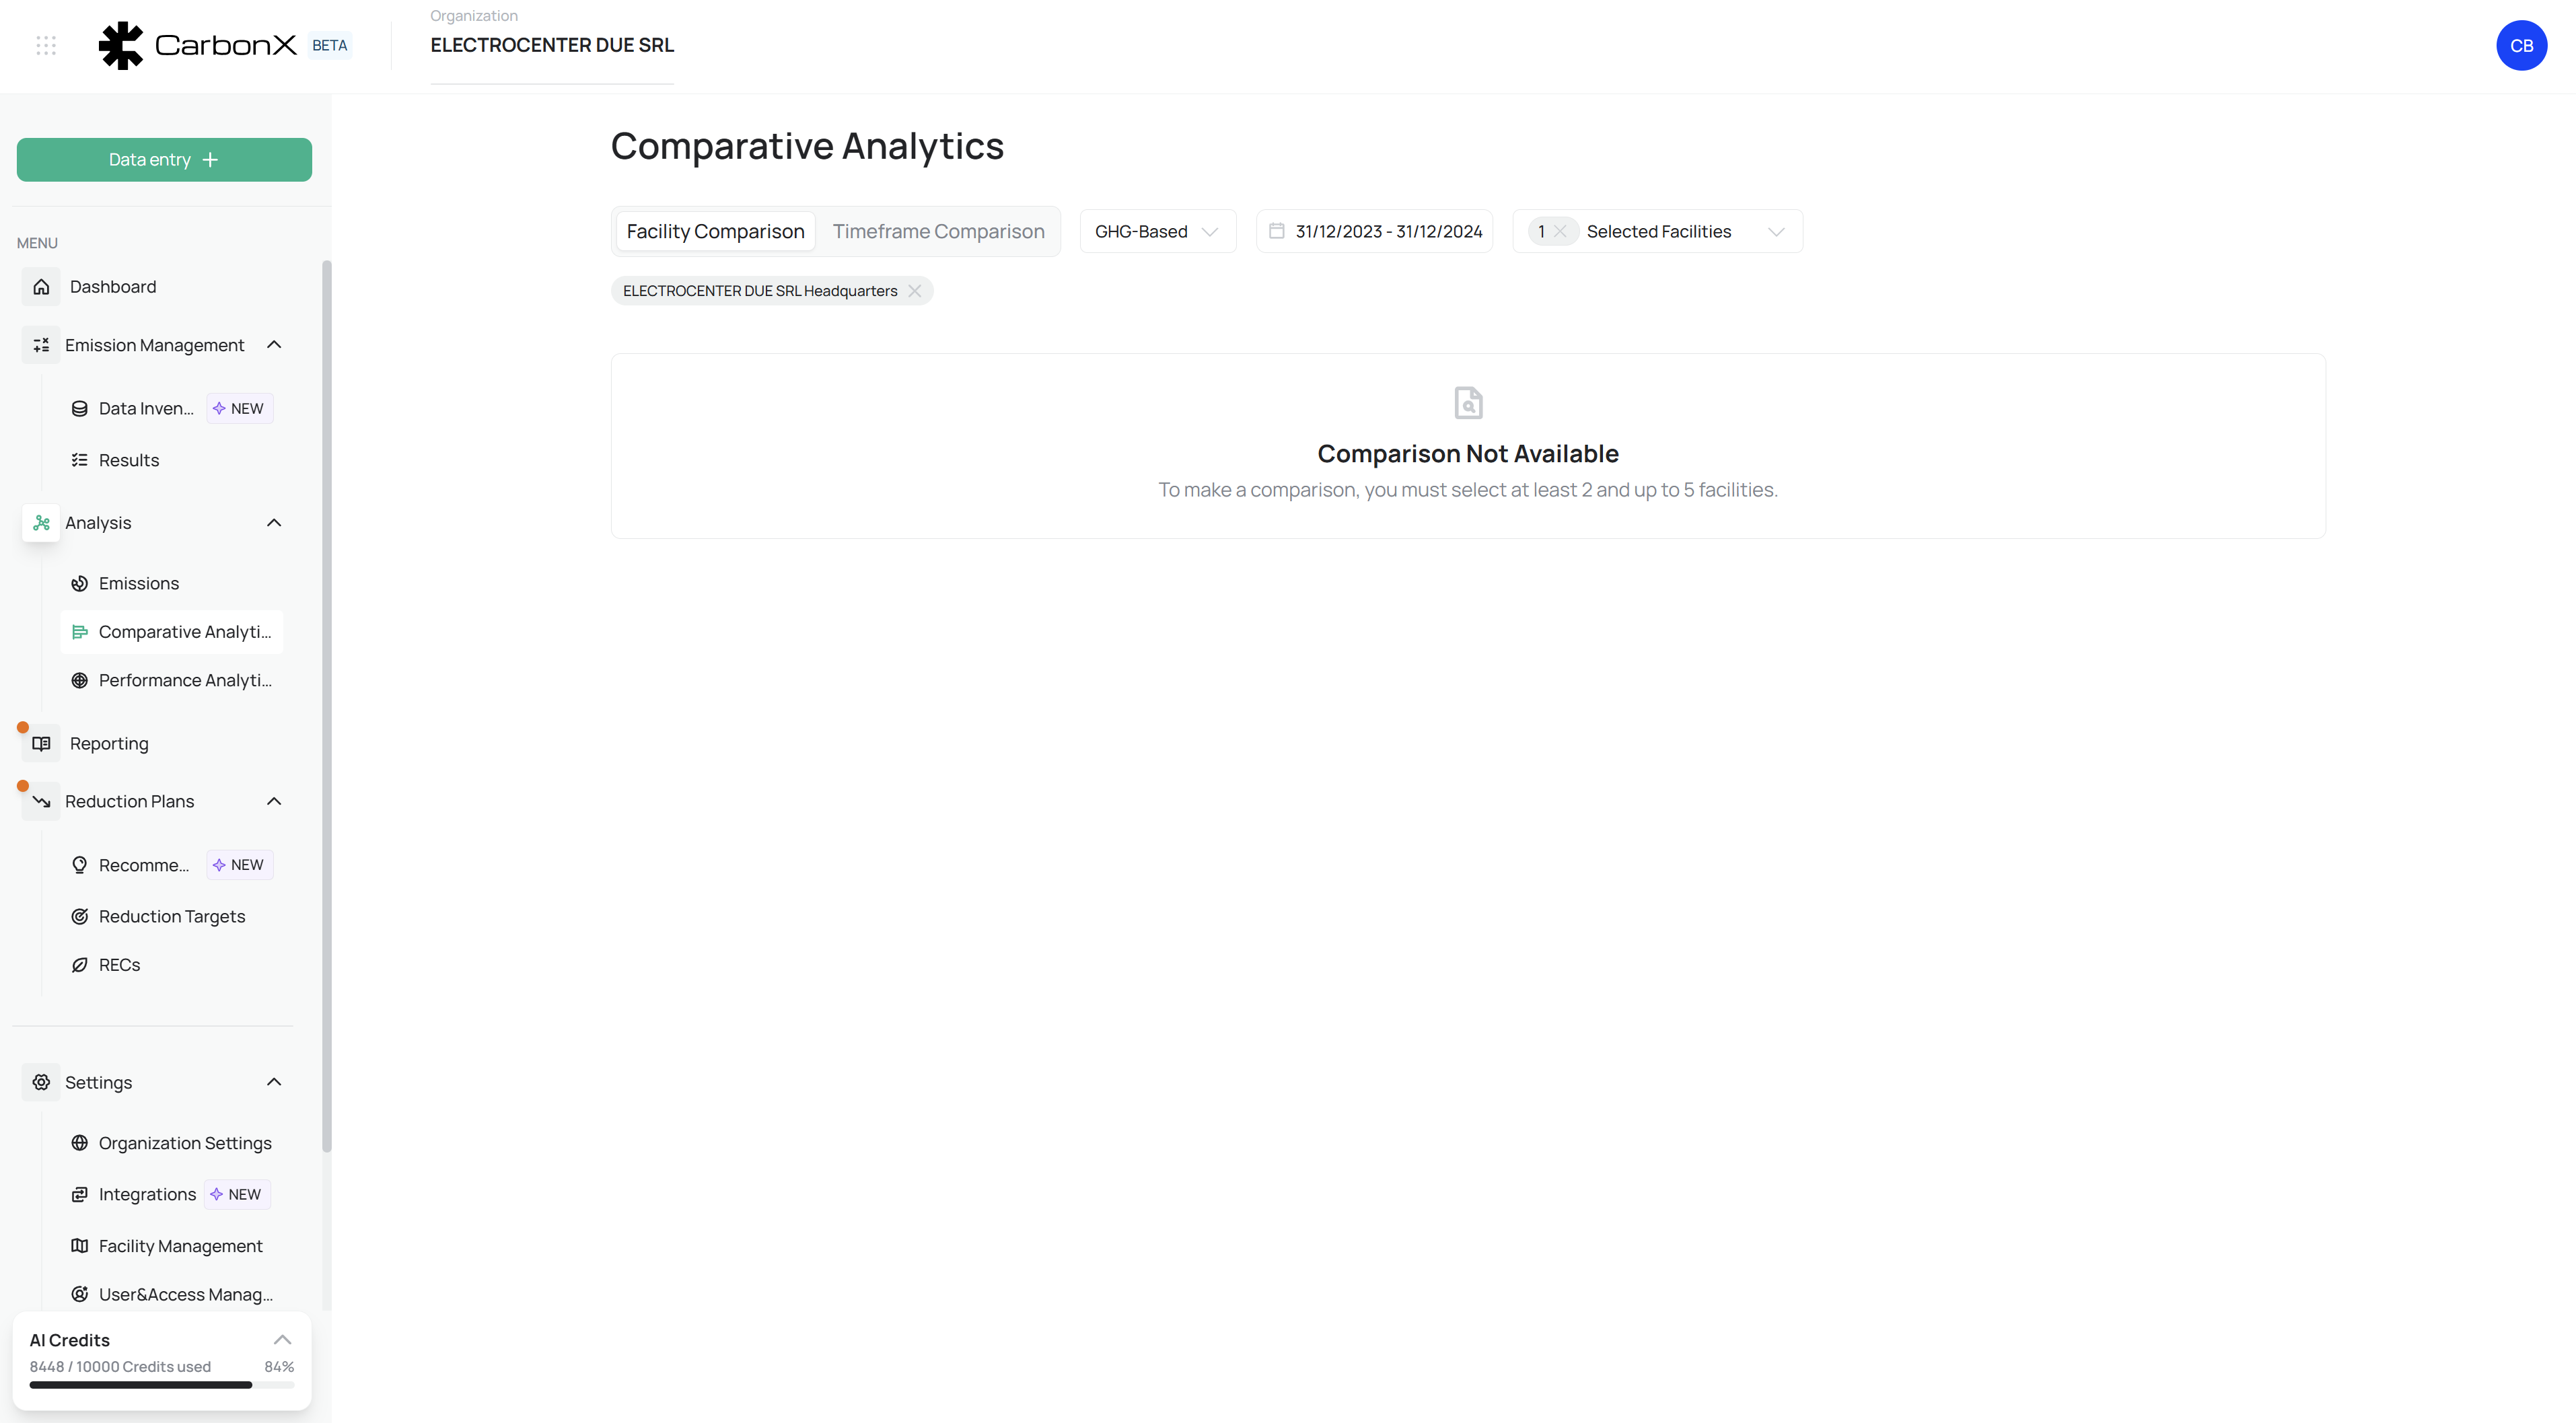
Image: Comparative Analytics interface showing multi-facility and multi-period benchmarking with dynamic GHG-based visualizations, facility filters, and interactive data insights.
1. Comparison Modes
The Comparative Analytics interface offers two primary benchmarking modes, each optimized for a different analytical perspective: Facility Comparison and Timeframe Comparison. Users can switch between these views using the mode selector at the top of the page.
A. Facility Comparison
This mode allows users to evaluate emissions data across multiple operational sites, creating an organization-wide performance snapshot.
Users can select between two to five facilities simultaneously, generating comparative graphs and metrics that highlight emission intensity, scope distribution, and facility-level efficiency.
Key Features:
Compare absolute emissions (tCO₂e) or emission intensity (e.g., tCO₂e per m², per employee, or per revenue unit).
Assess scope distribution by visualizing Scope 1, Scope 2, and Scope 3 proportions per facility.
Identify high-impact sites or outliers requiring targeted reduction measures.
Integrate facility metadata such as region or type (e.g., Headquarters, Production Site, Distribution Center) for context.
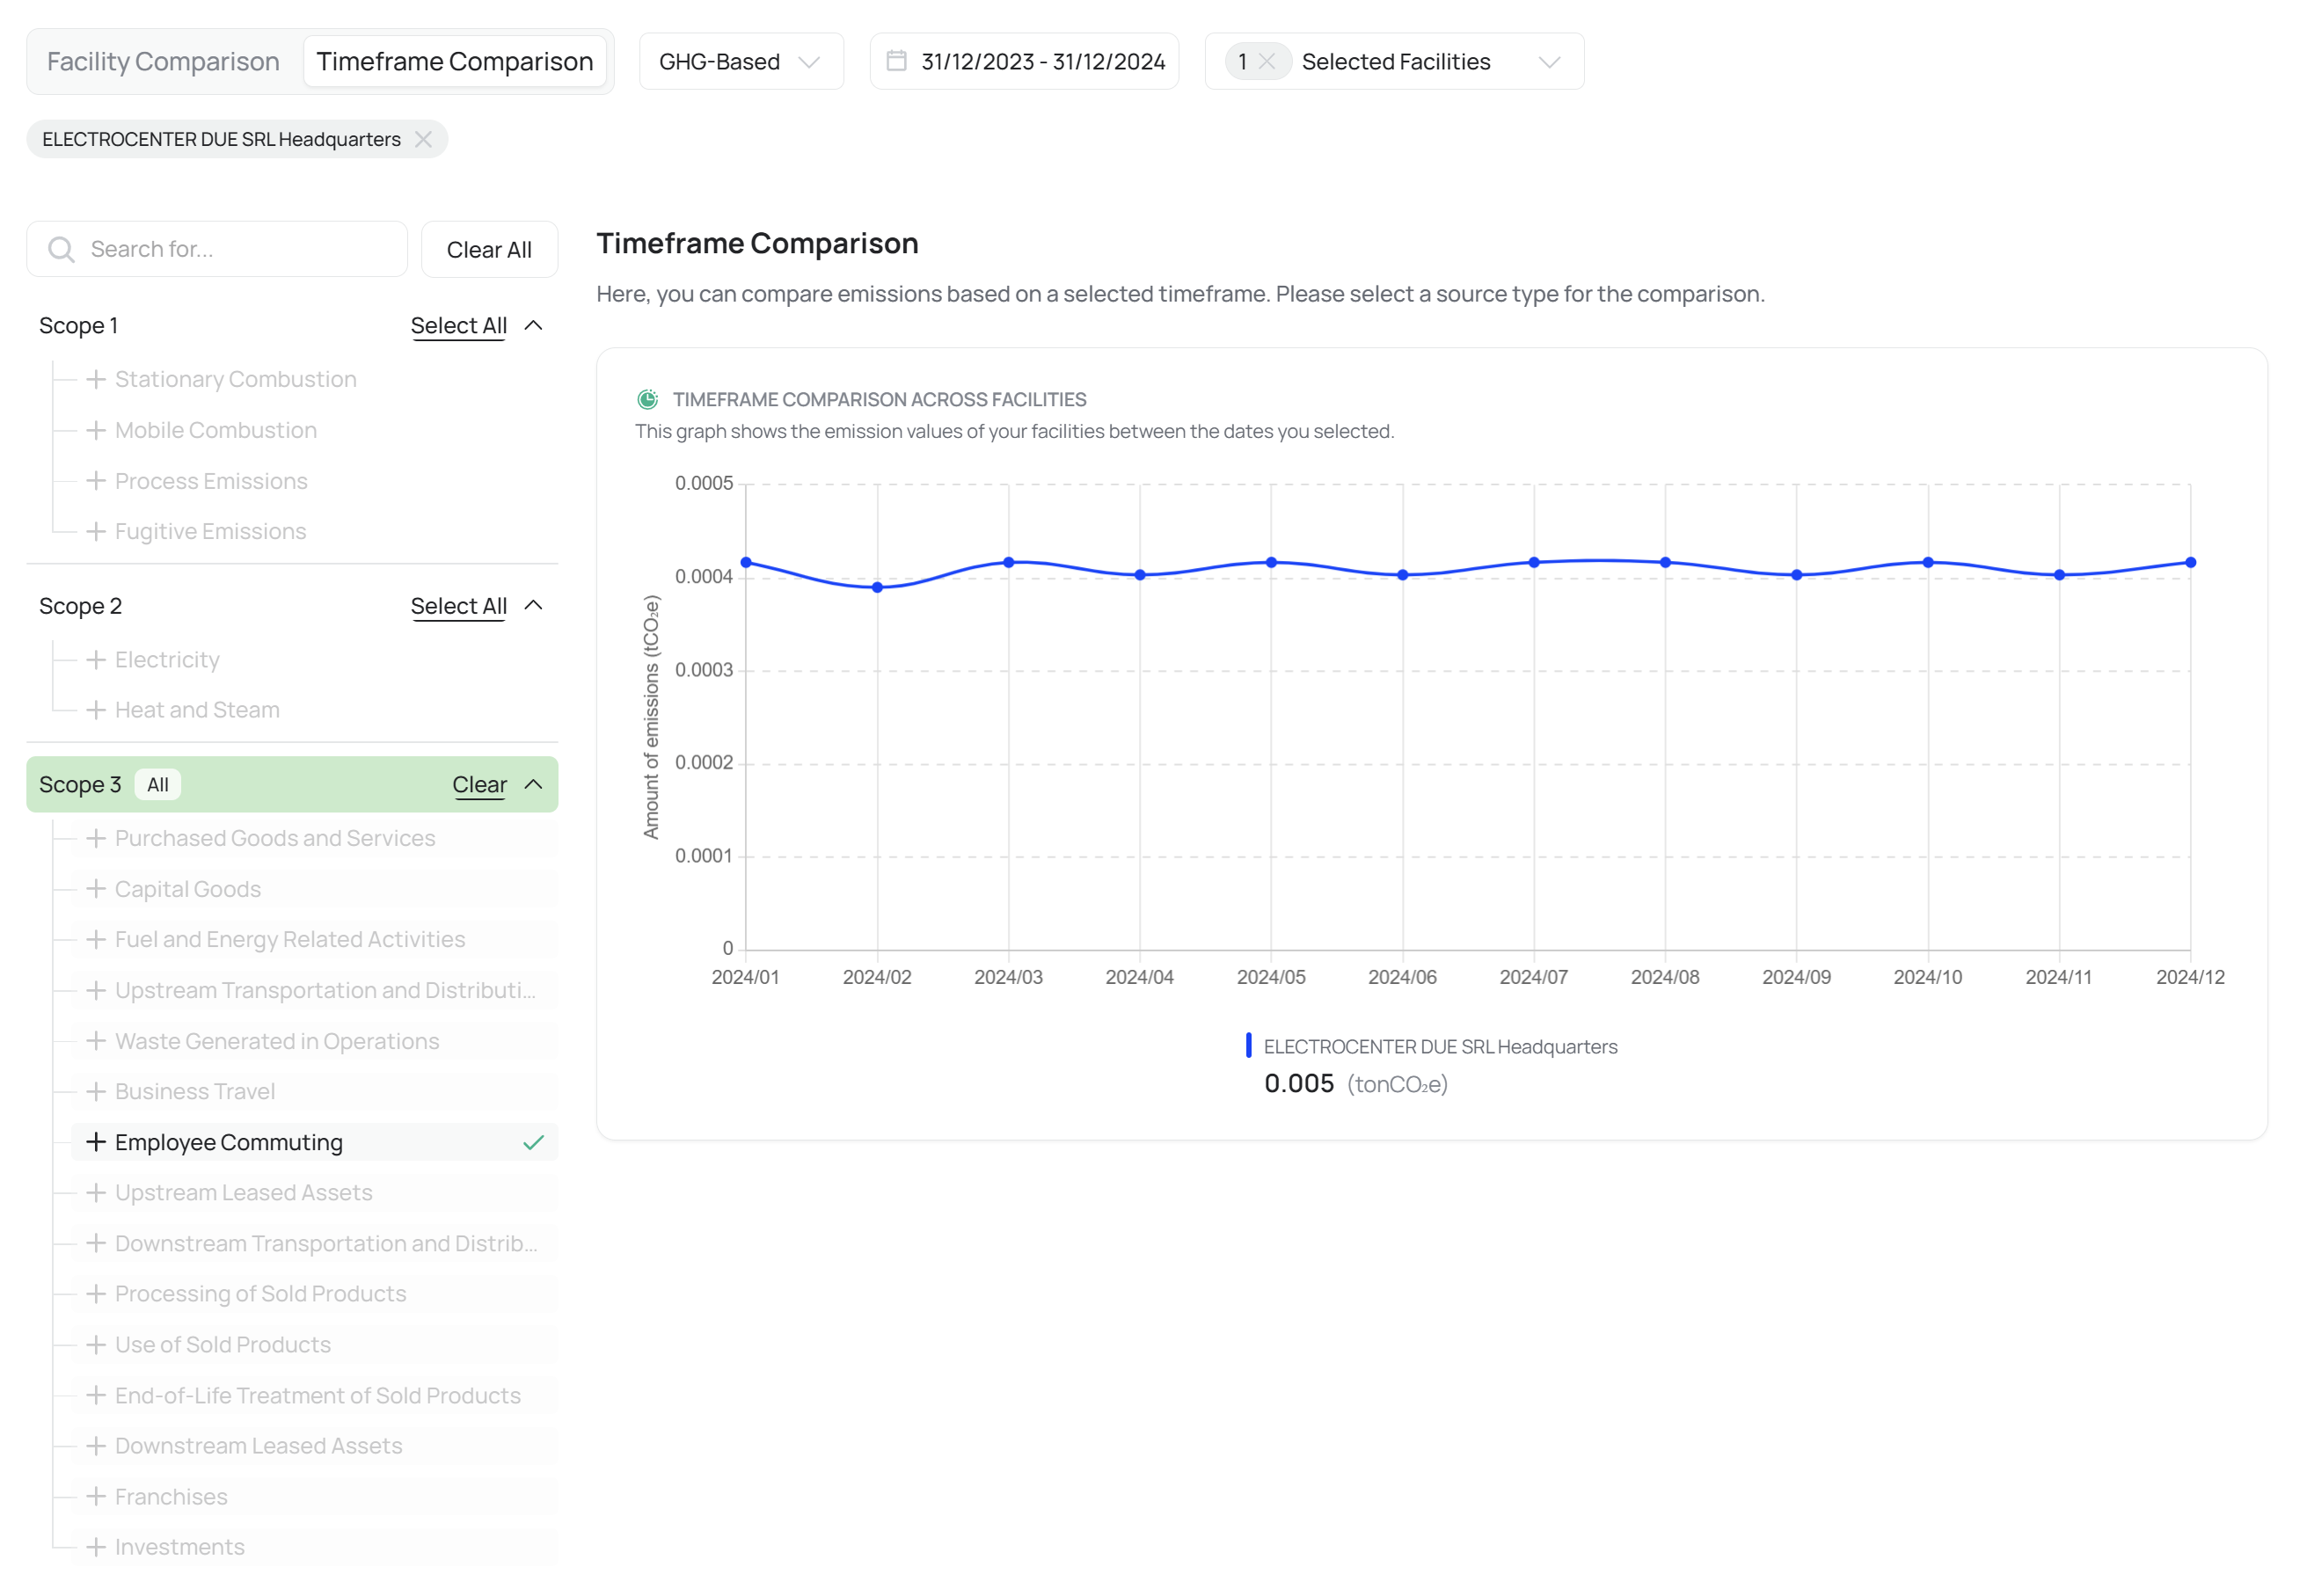
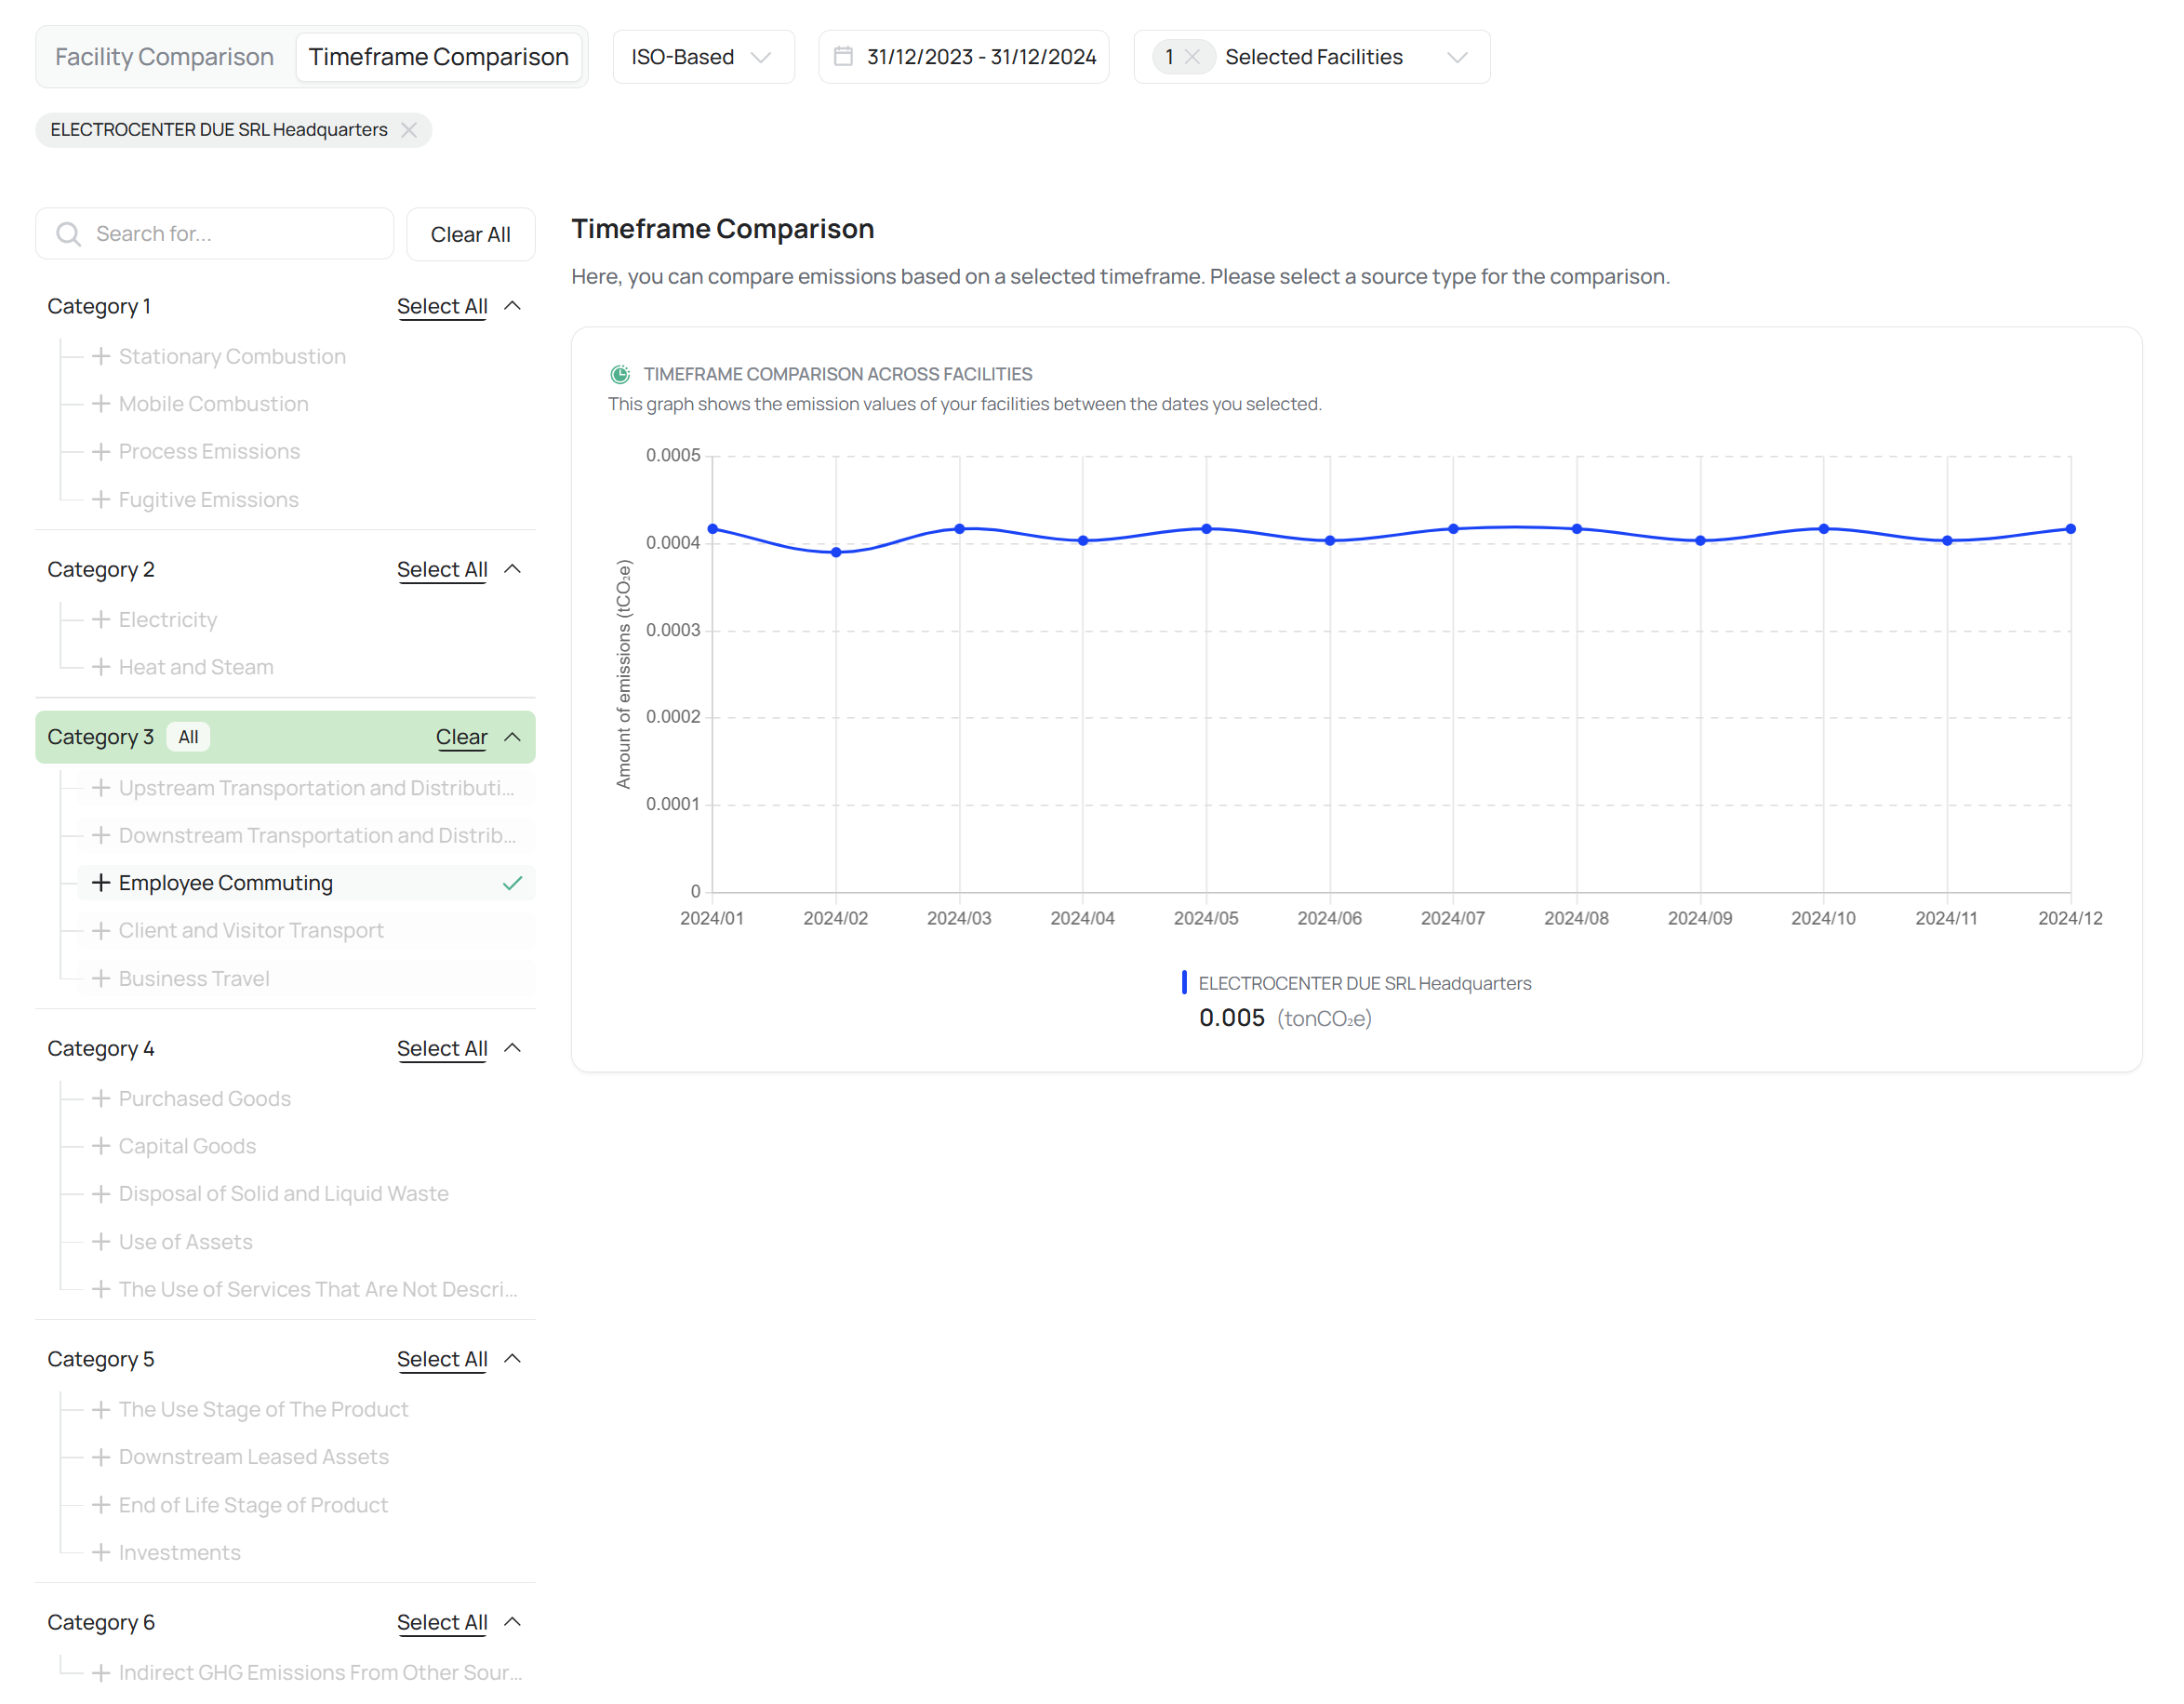
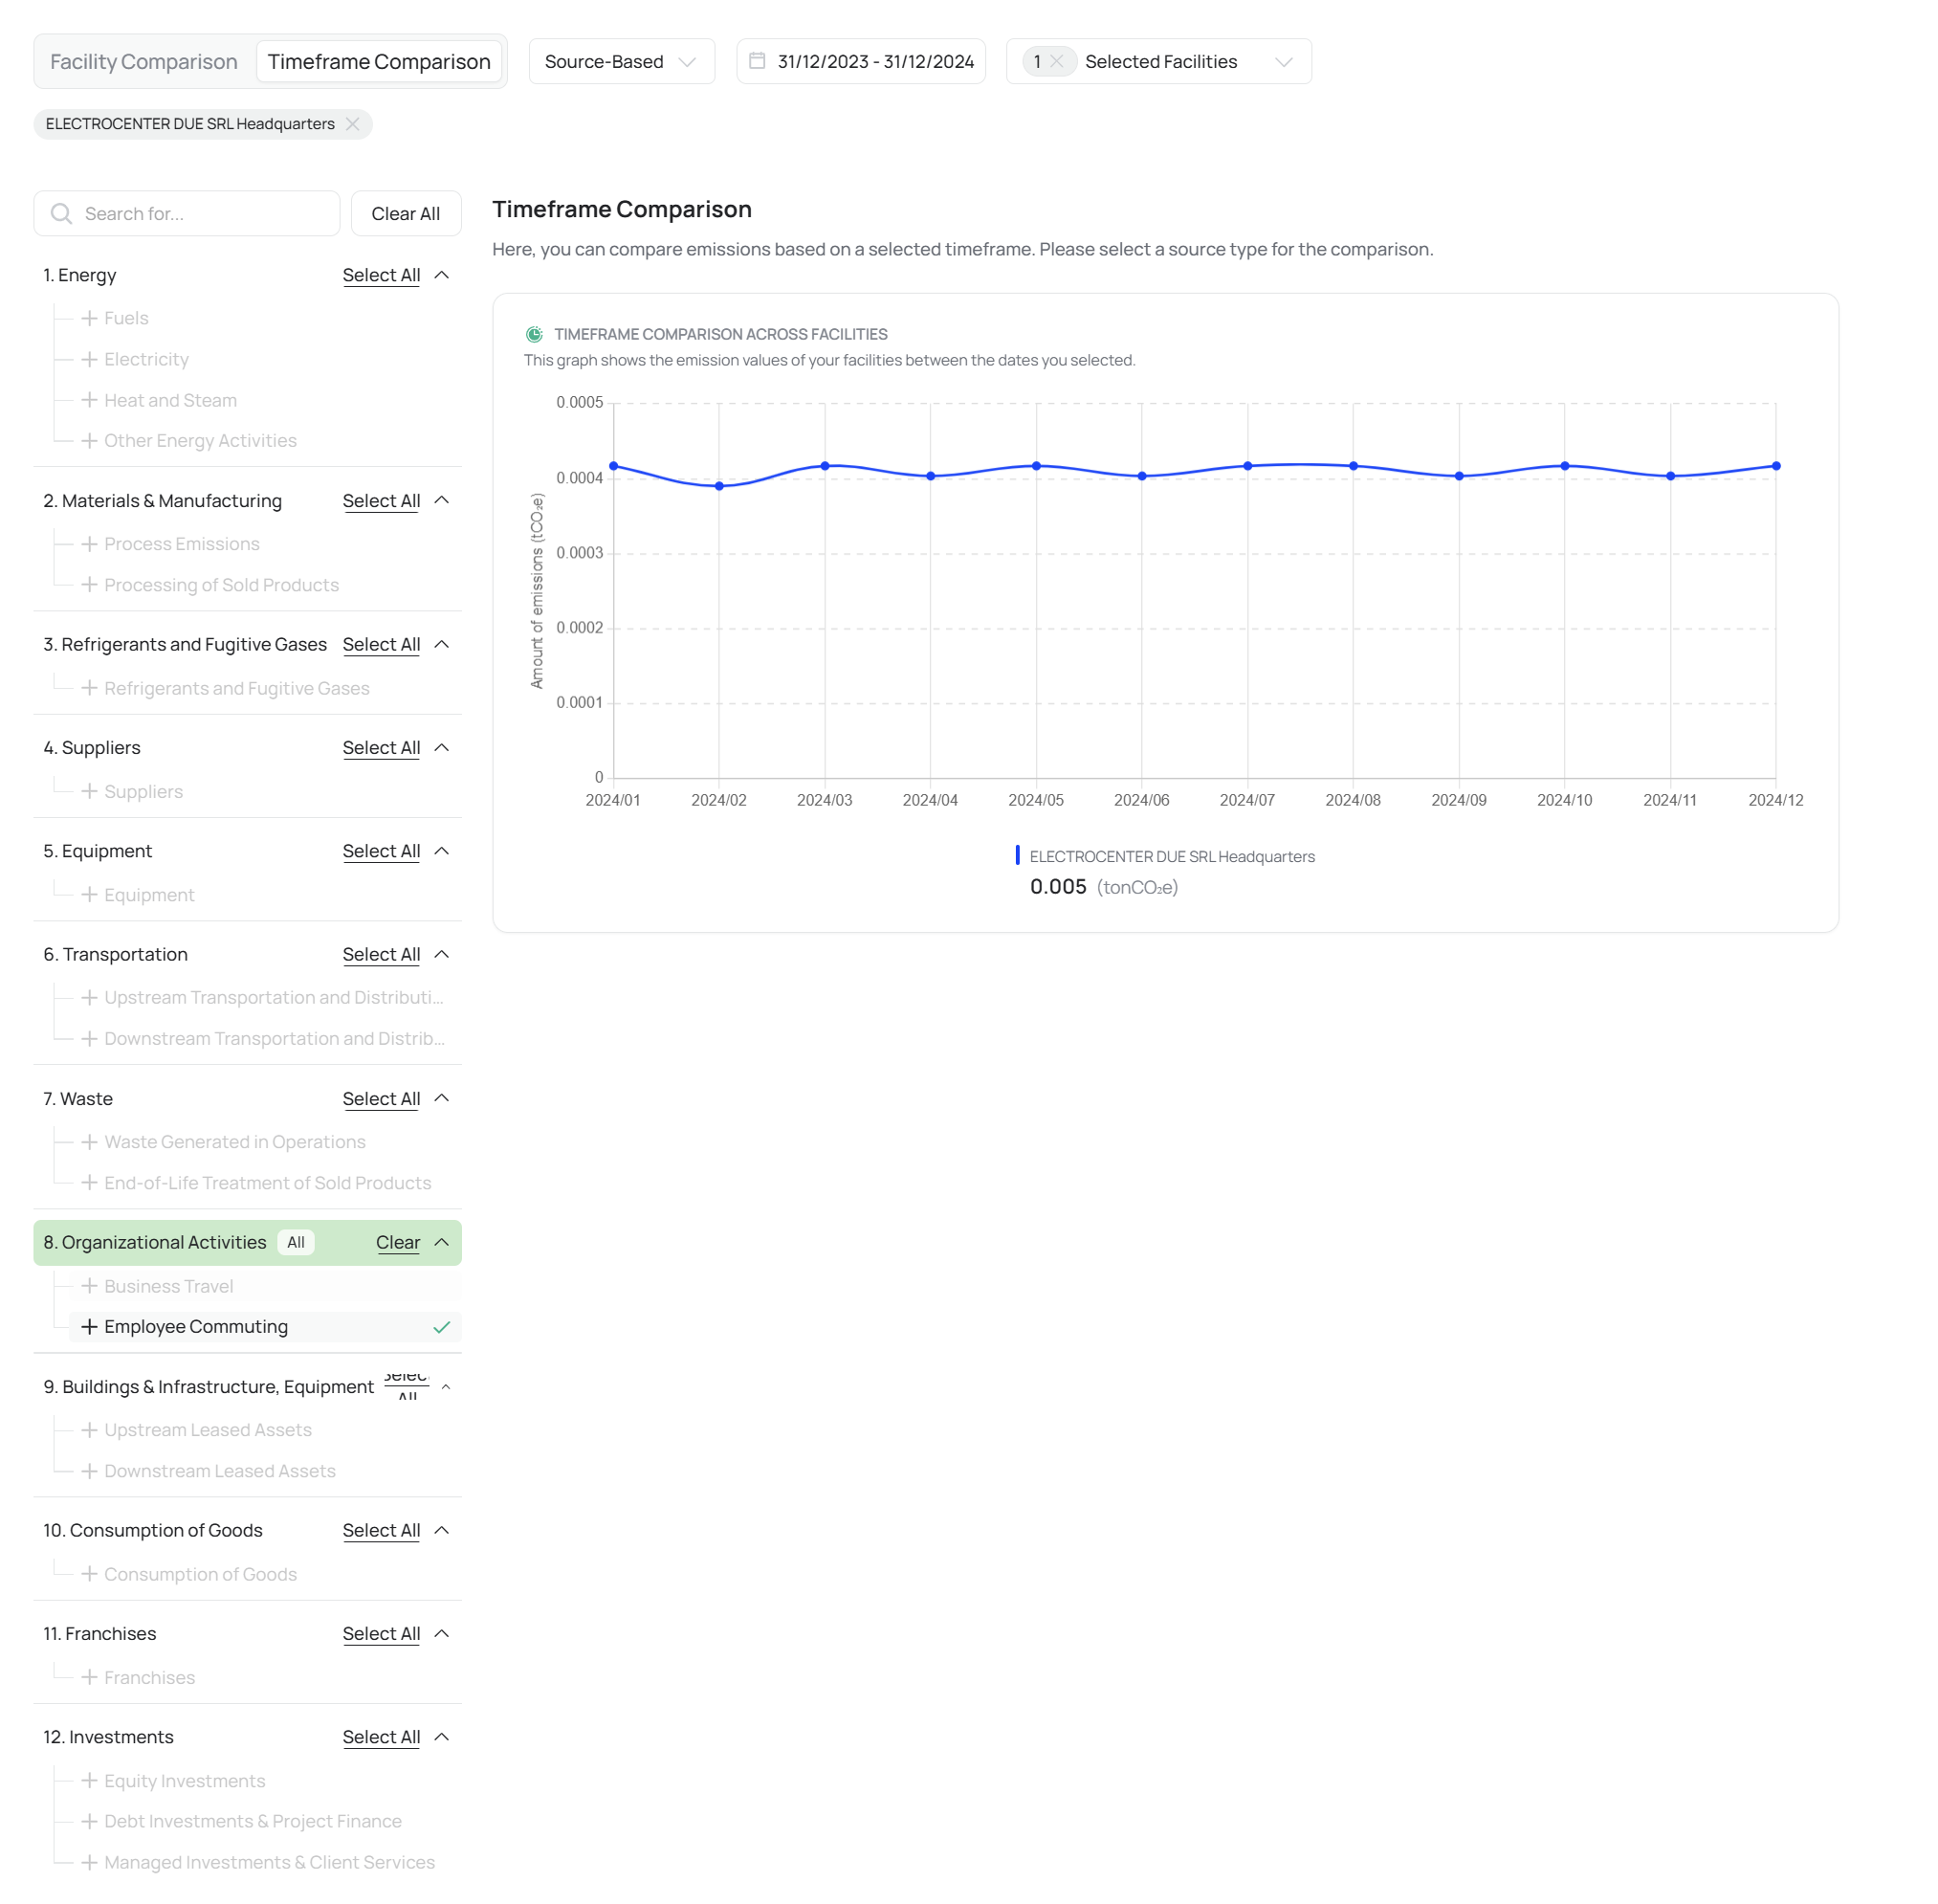
B. Timeframe Comparison
The Timeframe Comparison mode focuses on emission trends over time, helping users identify improvement trajectories, seasonal variations, or operational anomalies.
It aggregates data by reporting periods (monthly, quarterly, or yearly) and provides both absolute and relative views of emission changes.
Key Features:
Compare emissions for one facility (or the entire organization) across selected years or quarters.
Detect seasonal peaks or declines tied to production cycles or energy demand fluctuations.
Evaluate decarbonization progress by overlaying reduction targets or baseline year benchmarks.
Optionally include rolling averages or trendlines to visualize long-term performance evolution.
2. Comparison Frameworks
To maintain analytical continuity with the Emissions Analysis module, Comparative Analytics supports three standardized classification frameworks. Users can toggle between these frameworks using tab controls, ensuring a seamless transition from overall footprint assessment to comparative benchmarking.
Framework Options:
GHG-Based: Classifies results under Scopes 1, 2, and 3 per the Greenhouse Gas Protocol, ideal for compliance benchmarking.

ISO-Based: Reorganizes emissions under ISO 14064/14067 hierarchical categories (Category 1–6), aligning results with international verification standards.
Source-Based: Groups emissions by operational origin (Energy, Transportation, Waste, or Organizational Activities), ideal for facility optimization and internal diagnostics.
When switching frameworks, CarbonX automatically refreshes filters, charts, and tables, preserving consistency in units, methodology, and visual hierarchy.
3. Filtering & Selection Options
The filtering panel enables users to fine-tune their analysis for maximum precision. Filters dynamically interact with visualizations, ensuring that all charts and data tables reflect the selected parameters.
Available Filters:
Date Range Filter:
Define any start and end dates to focus analysis on specific periods — whether a quarter, fiscal year, or multi-year span.Facility Selector:
Choose one or more facilities for side-by-side performance evaluation. Multi-facility comparison supports both absolute and normalized emissions metrics.Scope Filters:
Drill down into Scope 1, Scope 2, or Scope 3 to isolate emissions from specific operational boundaries.
For example, users may compare Scope 2 (electricity-related) emissions between offices to evaluate energy management strategies.
4. Use Case and Strategic Value
The Comparative Analytics page is a decision-making tool designed to help organizations benchmark progress, validate reduction targets, and detect efficiency opportunities.
It transforms static data into comparative intelligence that supports both corporate sustainability strategy and operational optimization.
Primary Use Cases:
Progress Tracking:
Measure emission reductions year-over-year to confirm alignment with organizational decarbonization goals.Performance Benchmarking:
Identify which facilities demonstrate superior efficiency or require corrective measures.Operational Diagnostics:
Detect patterns of emission spikes that may indicate equipment inefficiencies, production anomalies, or data inconsistencies.Reporting Validation:
Confirm that emissions across time and location align with declared performance metrics before publishing reports.
Example:
An auditor uses the facility comparison to evaluate five regional warehouses and identifies one location with a 12% higher Scope 3 footprint, prompting a follow-up investigation into logistics practices.
5. Best Practices
Use Timeframe Comparison before target review sessions to contextualize progress against baseline years.
Leverage Facility Comparison for management briefings to spotlight leading and lagging facilities.
Apply consistent framework filters (GHG, ISO, or Source-Based) when preparing multi-period reports to maintain methodological integrity.
Export comparative charts quarterly to track reduction trajectories in organizational KPIs.
Combine Comparative Analytics results with Performance Metrics (intensity-based KPIs) for a holistic assessment of efficiency.