Analysis → Emissions
The Emissions Analysis page provides an advanced, multi-dimensional visualization of an organization’s carbon footprint, enabling users to examine, compare, and interpret emission results through multiple international classification frameworks.
Written By CarbonX Registry
Last updated 9 months ago
It serves as the analytical bridge between calculated results and strategic decision-making, translating raw data into insights aligned with recognized sustainability standards like the Greenhouse Gas (GHG) Protocol and ISO 14064/14067.
This module helps sustainability professionals, auditors, and executives identify emission hotspots, track performance over time, and prepare tailored outputs for compliance reporting or internal management review.
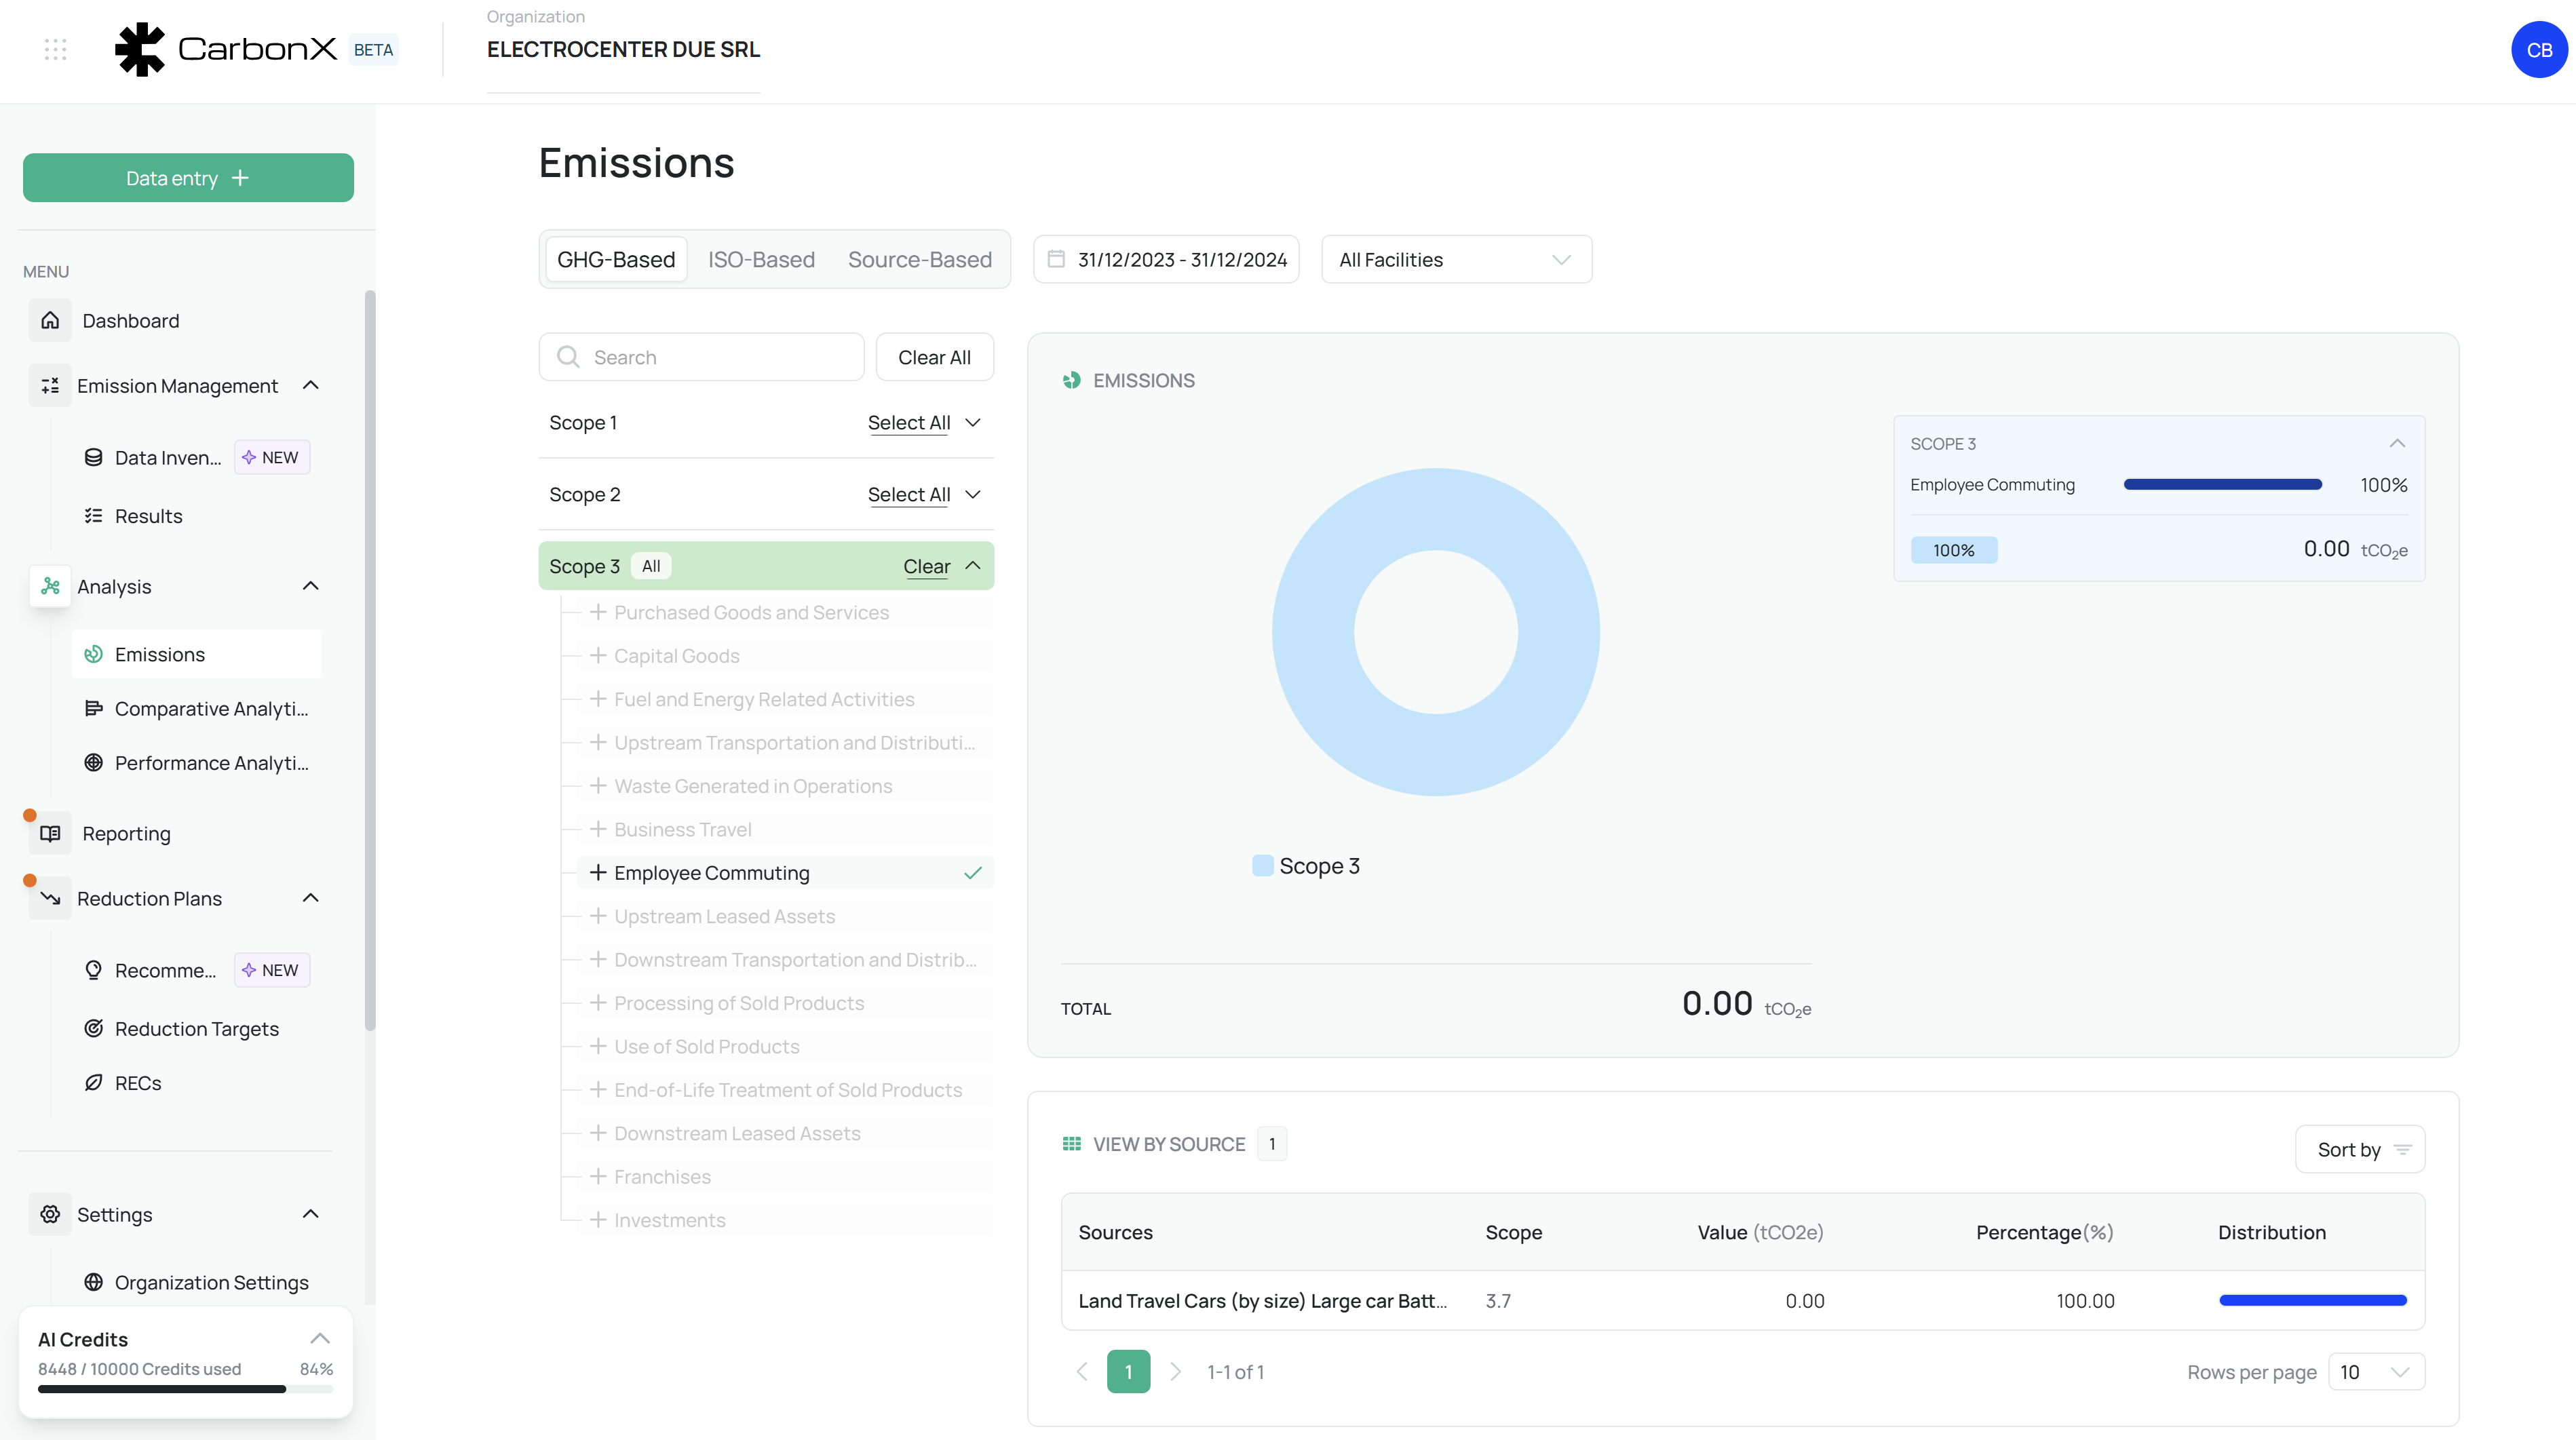
Image: Emissions Analysis module displaying GHG-, ISO-, and Source-based analytical modes with dynamic filters, interactive visualizations, and emission distribution summaries.
1. Three Analytical Modes
The module offers three complementary analytical perspectives — each following a distinct reporting logic and data grouping structure. Users can switch between these modes via intuitive tabs, instantly reconfiguring charts and tables based on the selected framework.
A. GHG-Based Mode
This mode follows the Greenhouse Gas Protocol, categorizing emissions by Scope 1, Scope 2, and Scope 3 — the globally recognized structure for carbon accounting.
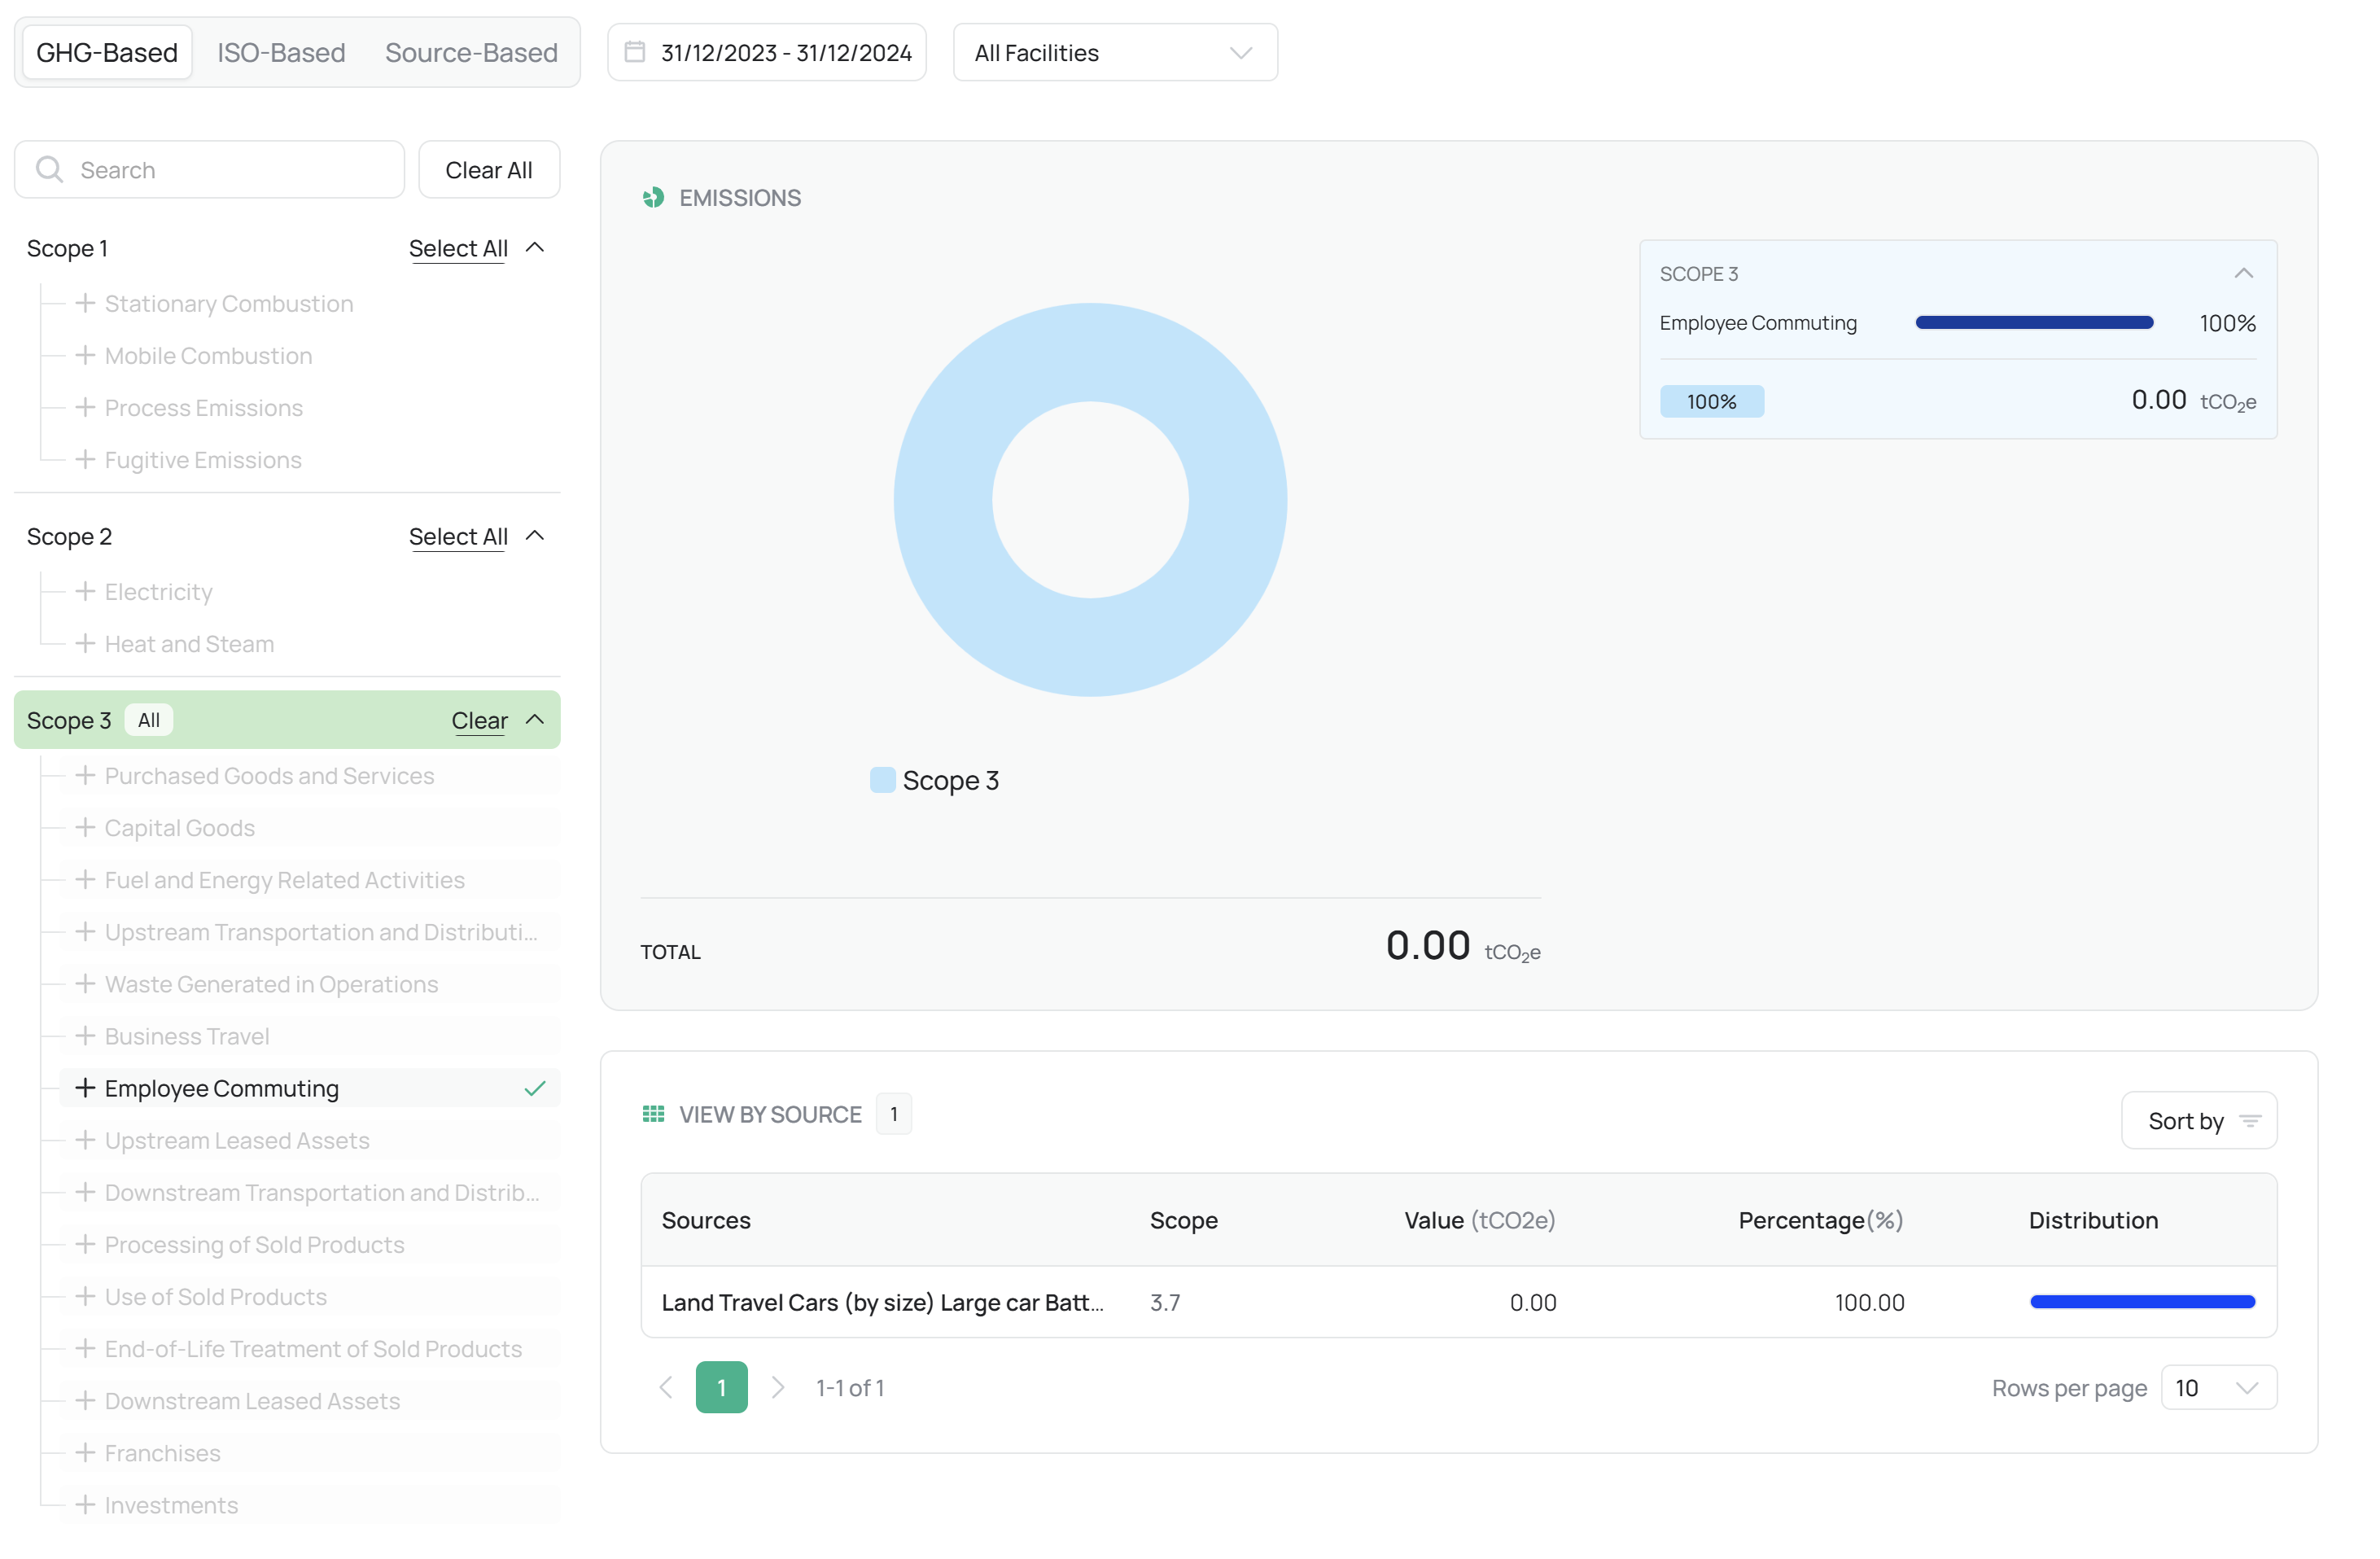
Features & Structure:
Scope 1: Direct emissions from owned or controlled sources (e.g., stationary combustion, mobile vehicles, fugitive gases).
Scope 2: Indirect emissions from purchased electricity, steam, heating, or cooling.
Scope 3: All other indirect emissions across the value chain, including:
Purchased goods and services
Business travel
Waste generated in operations
Employee commuting
Upstream and downstream logistics
Each scope is expandable to show subcategories, emission sources, and facilities.
Users can toggle between absolute (tCO₂e) and relative (%) views for normalized comparisons.
Use Case:
Ideal for organizations preparing GHG-compliant inventories, CDP submissions, or science-based targets (SBTi) alignment.
B. ISO-Based Mode
The ISO-Based analysis aligns data with the ISO 14064/14067 framework, offering a structured, hierarchical representation of emissions by Category 1–6 according to the ISO reporting methodology.
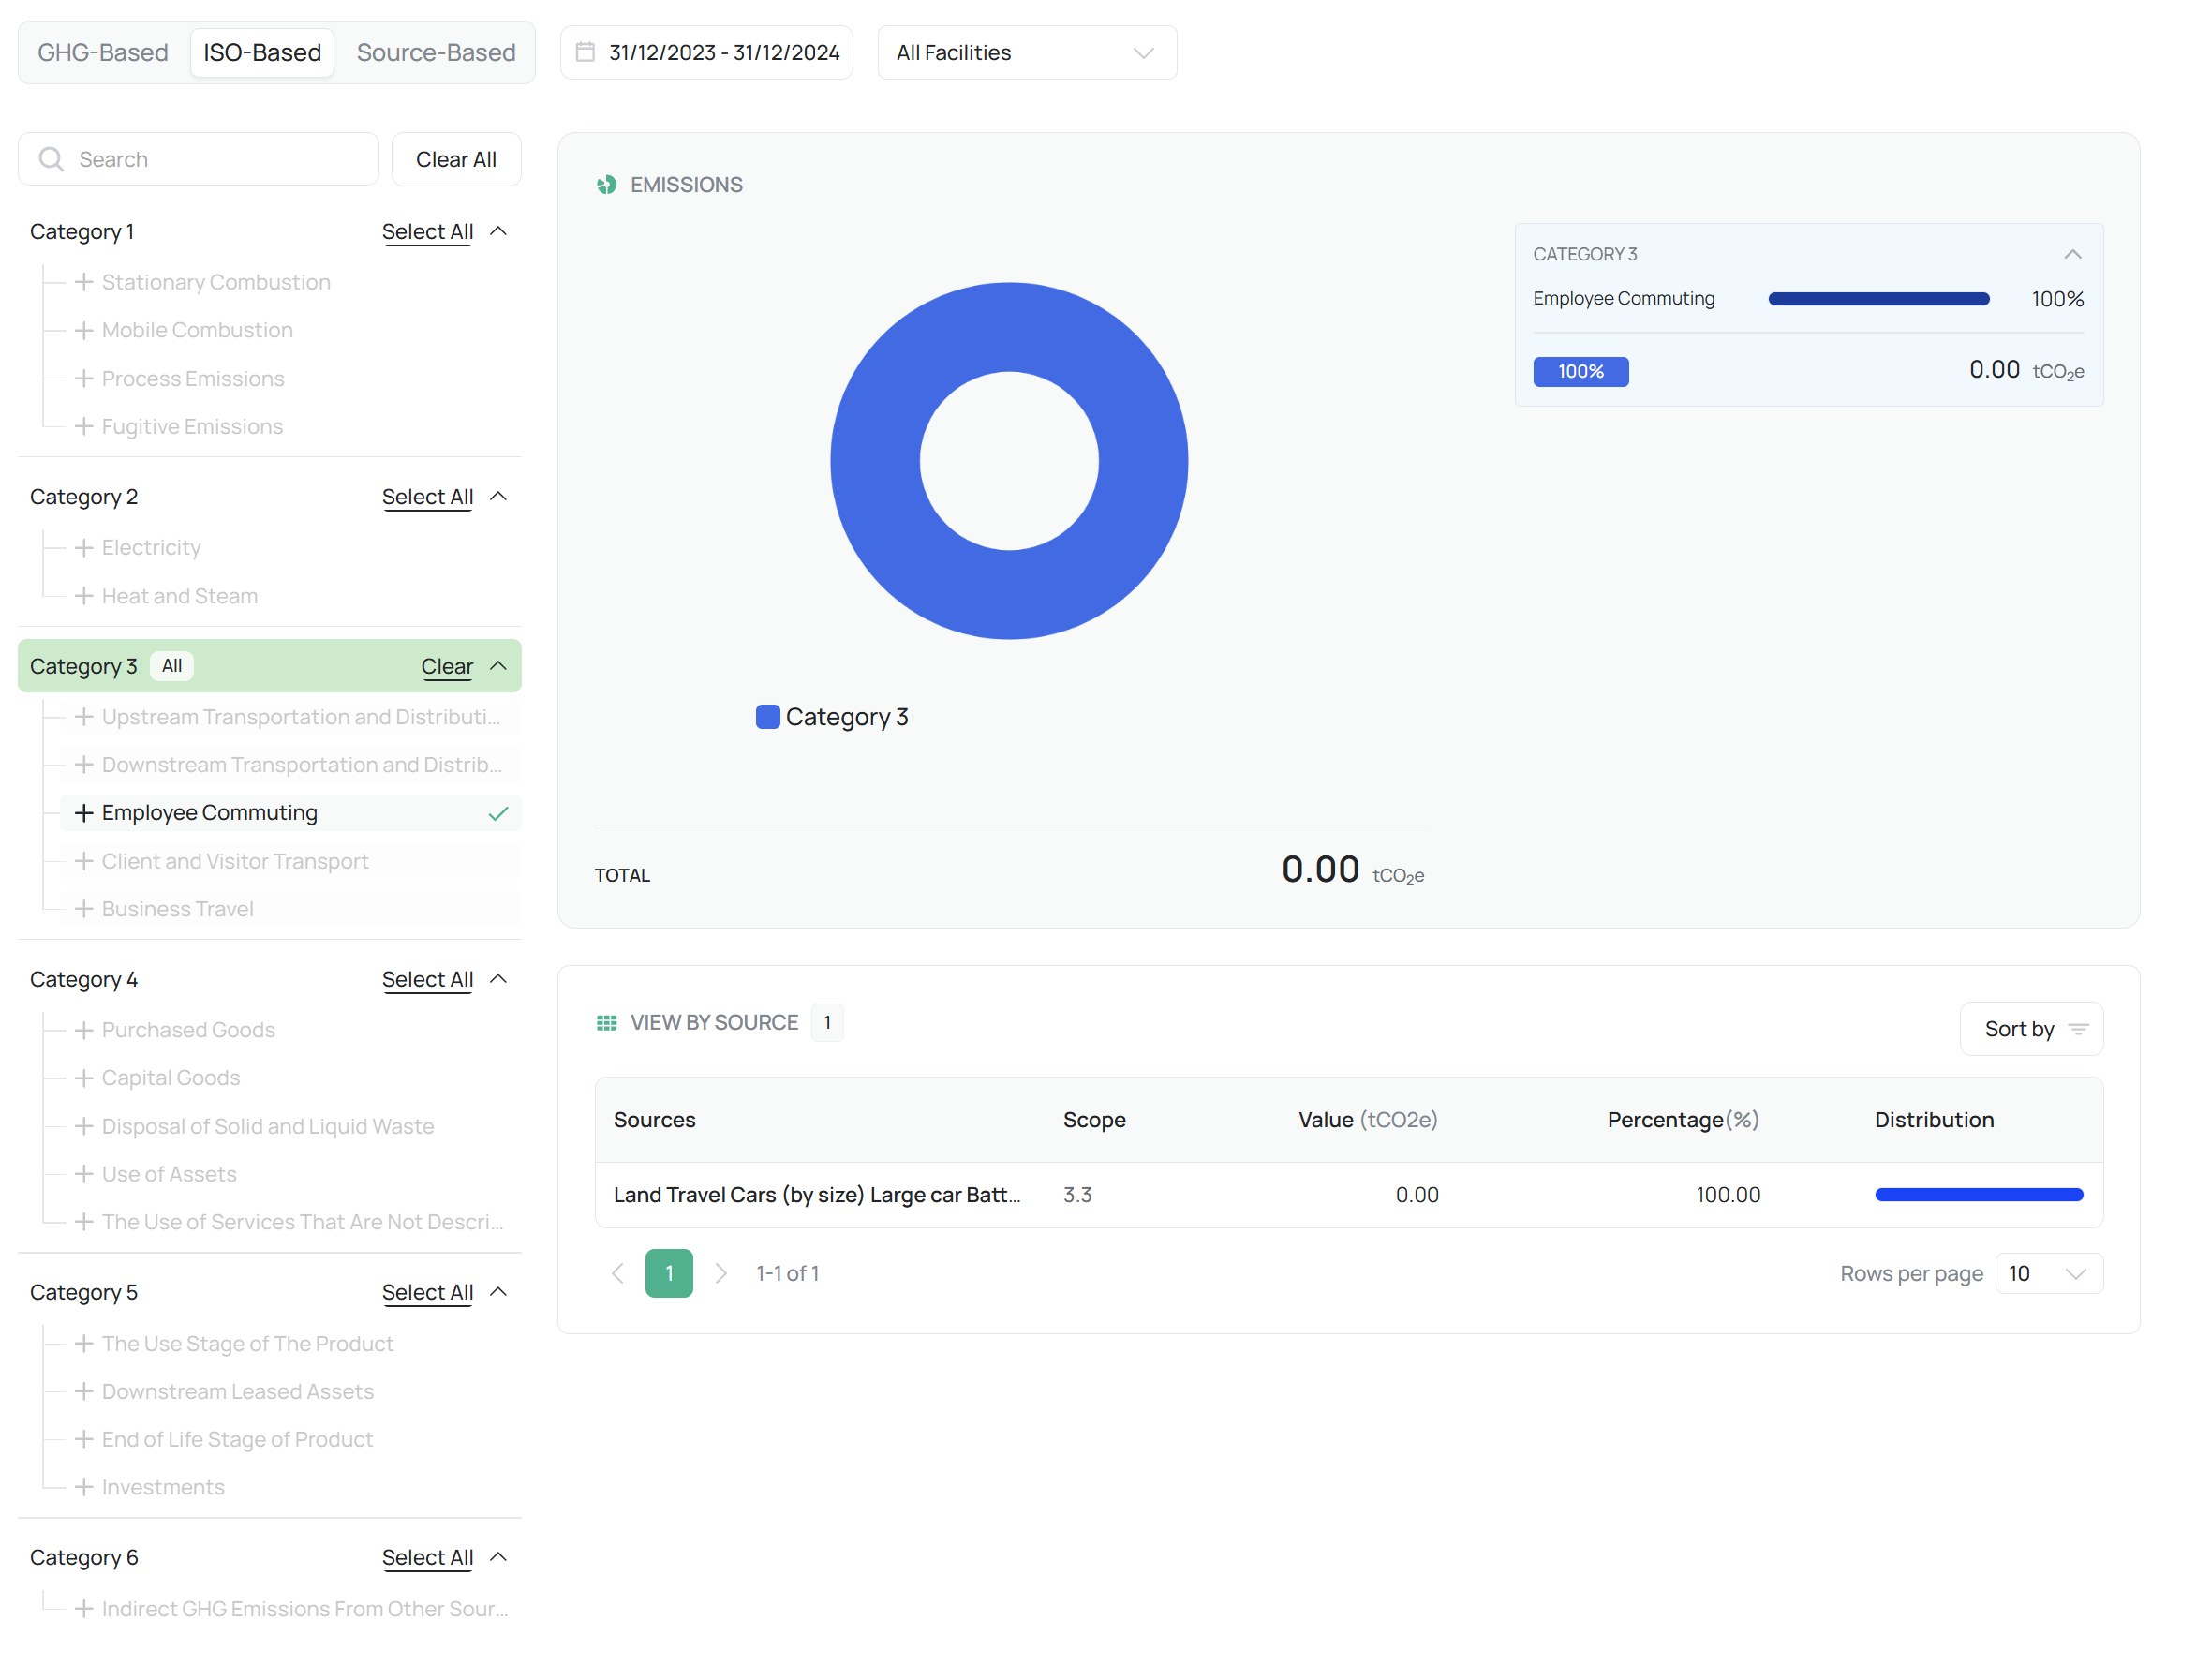
Typical Category Structure:
Direct GHG Emissions
Energy Indirect GHG Emissions
Other Indirect GHG Emissions
GHG Removals
Upstream/Downstream Activities
Other Relevant Emissions or Offsets
Each activity in the organization’s data inventory is automatically mapped to its corresponding ISO category, creating consistency across international reports and ESG systems.
Use Case:
Tailored for global corporations, ESG harmonization, and audit readiness under international standards such as ISO 14064 verification.
C. Source-Based Mode
The Source-Based mode reorganizes emissions data by operational origin — a structure optimized for internal diagnostics, facility performance analysis, and reduction planning.
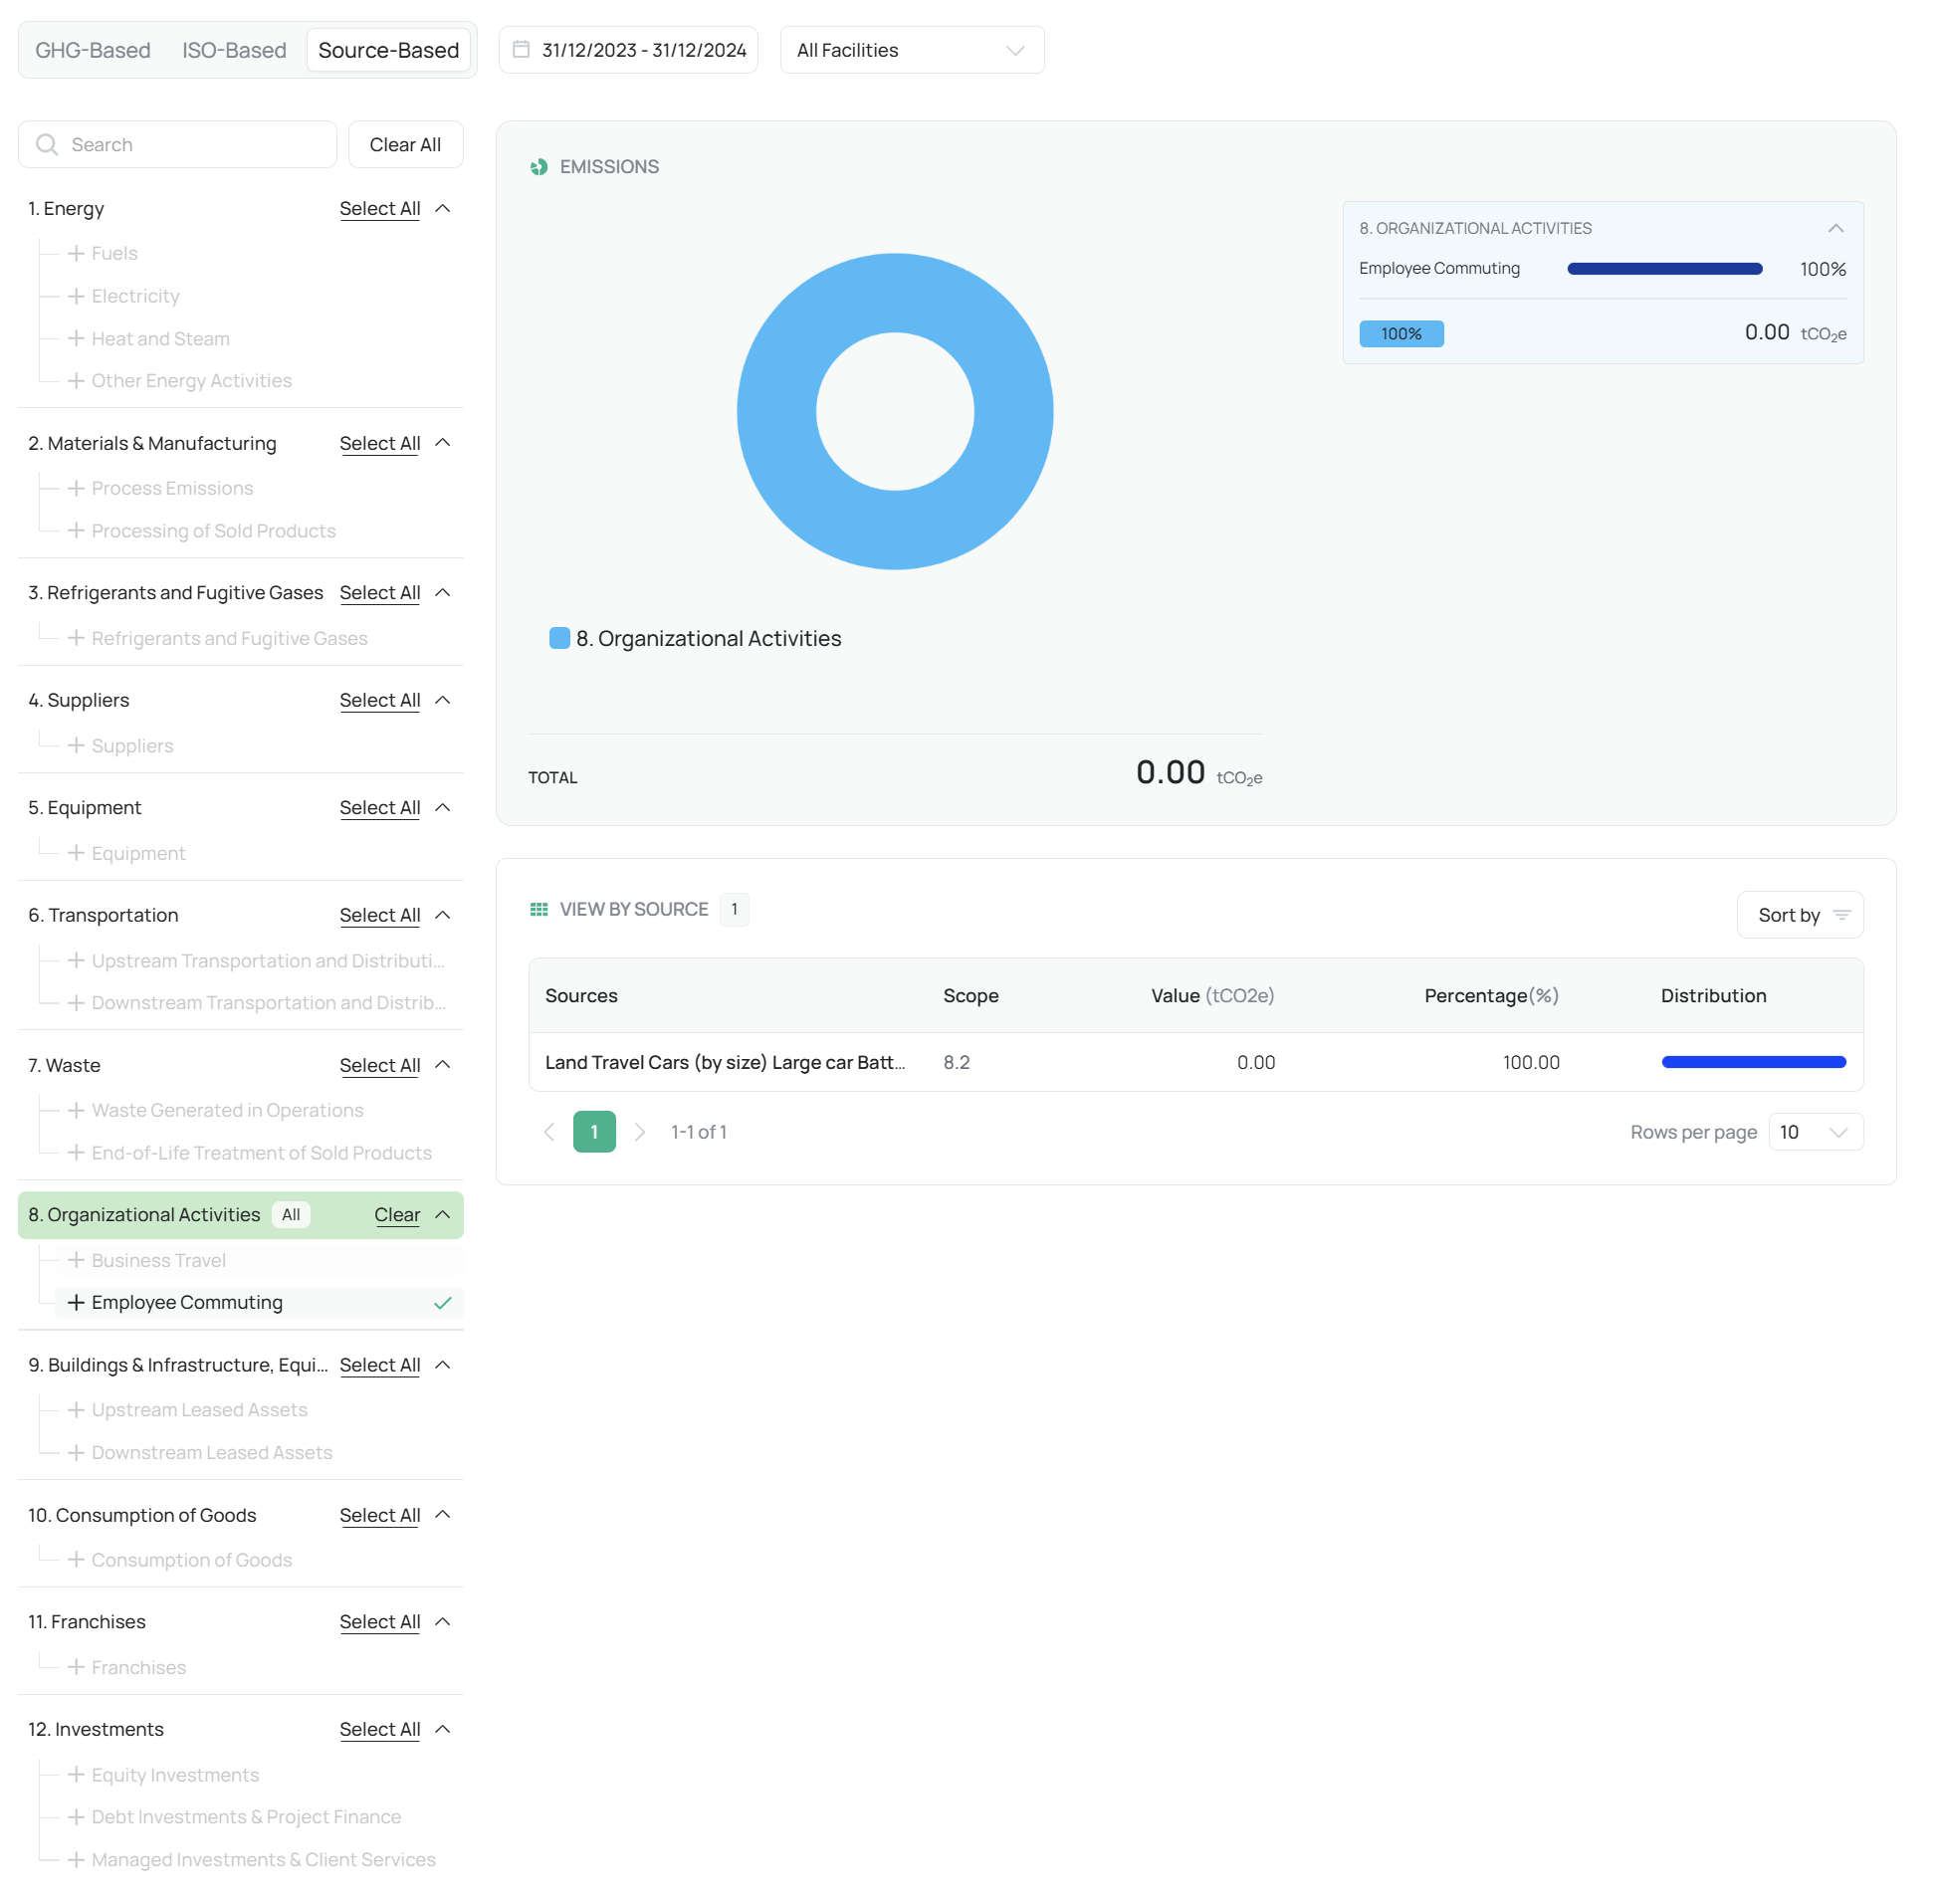
Main Source Categories:
Energy: Electricity, natural gas, fuel oil, steam, renewable generation.
Transportation: Vehicle fleets, freight logistics, employee commuting, air travel.
Waste: Solid waste, wastewater, recycling, and disposal-related emissions.
Organizational Activities: Purchased goods, capital assets, and office operations.
This mode is particularly valuable for facility-level managers and sustainability teams seeking actionable insights into operational efficiency and emission reduction opportunities.
Use Case:
Ideal for internal performance tracking, facility benchmarking, and target-setting exercises.
2. Filtering & Visualization Tools
To enhance analytical flexibility, the Emissions Analysis module integrates a range of interactive tools and filters that help users customize and interpret data with precision.
A. Date and Facility Filters
Enables users to compare emissions over multiple reporting periods, such as year-over-year or quarter-to-quarter analysis.
Supports multi-facility comparison, allowing cross-site performance evaluation or organizational roll-ups.
Optional filters include Scope, Source Type, and Emission Category, allowing focused analysis on selected datasets.
B. Interactive Donut Chart
A central visual component of the page, the donut (ring) chart dynamically updates based on the selected analytical mode.
It visually represents emission distribution by scope, category, or operational source, instantly highlighting the most significant contributors.
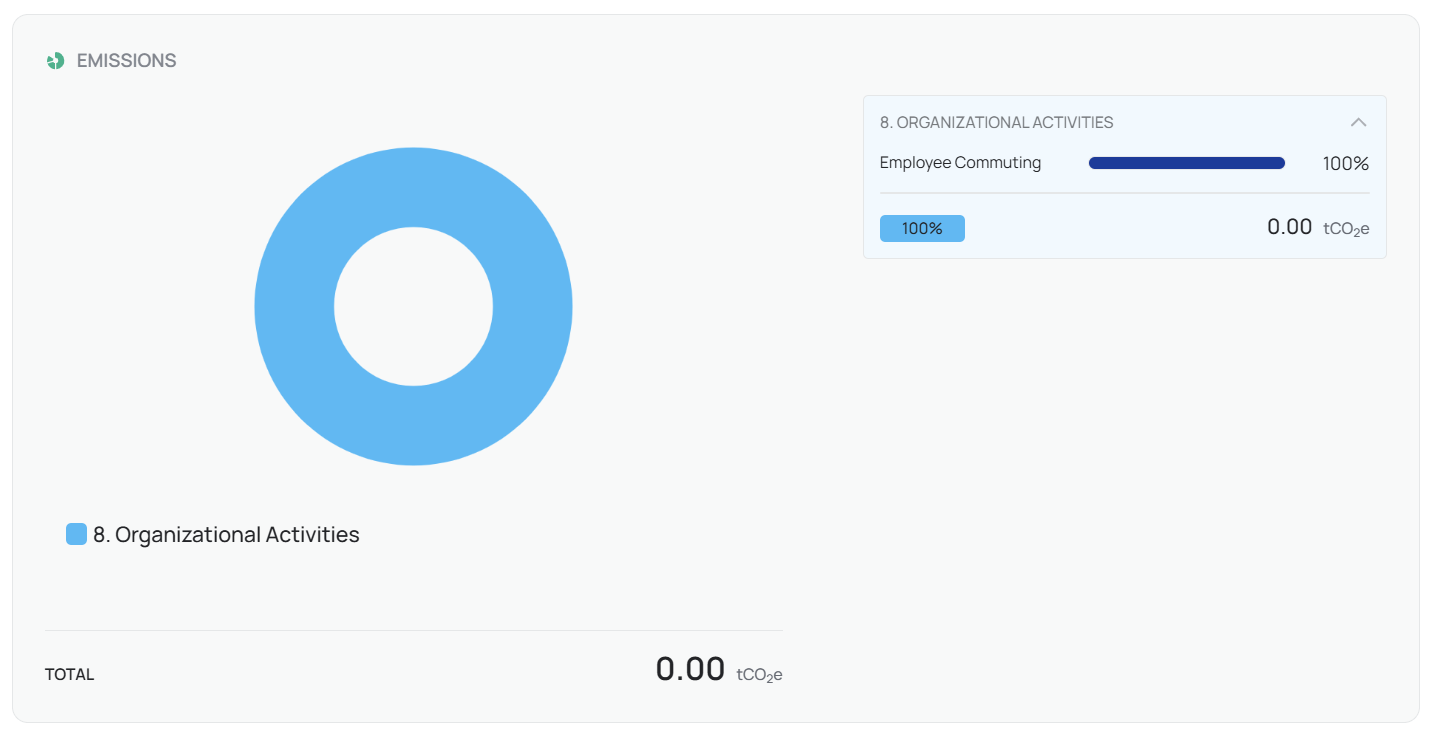
Hovering over chart segments reveals:
Category or scope name
Exact emission value (tCO₂e)
Percentage contribution to total emissions
Benefit:
Provides at-a-glance visualization for executives and quick insight into emission hotspots.
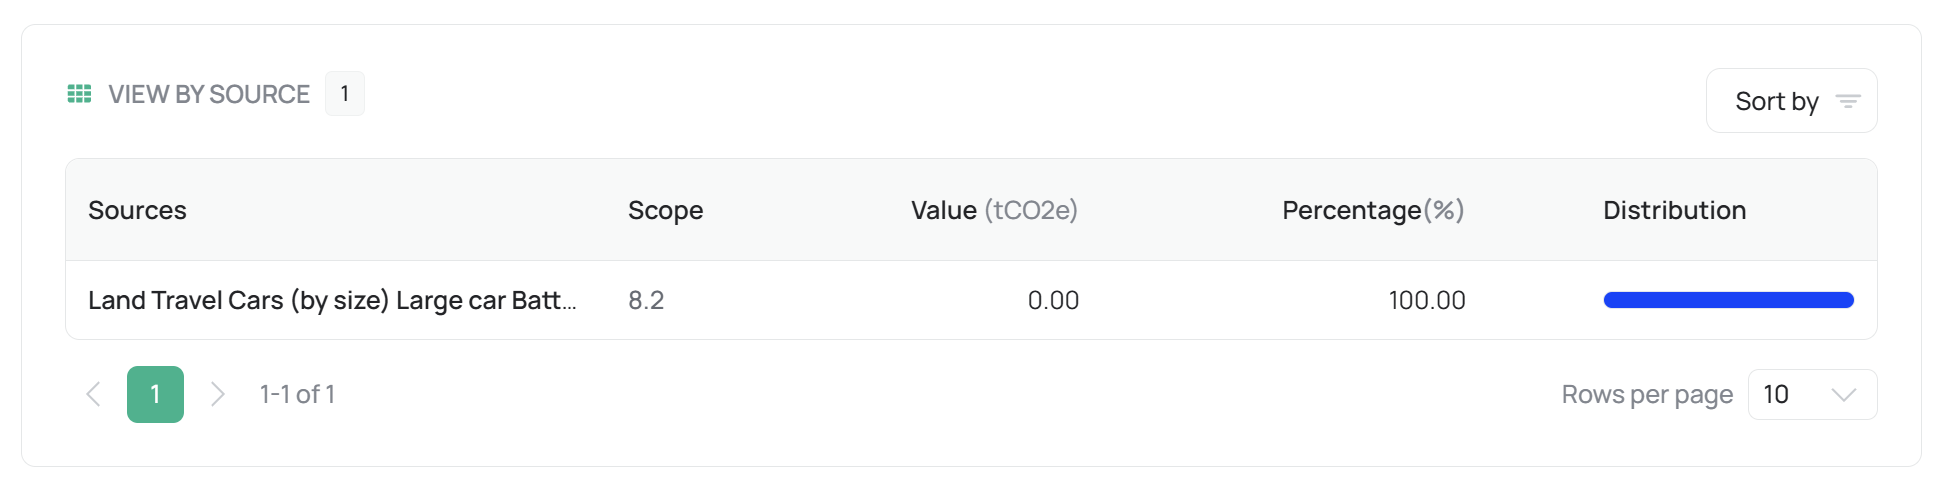
C. “View by Source” Table
Beneath the chart, a structured table presents the quantitative details behind each emission segment
3. Use Case & Functional Role
The Emissions Analysis page is purpose-built to transform verified emissions data into decision-ready intelligence.
It enables users to interpret results across regulatory, scientific, and operational contexts — ensuring that a single dataset can be flexibly reported under different compliance or management frameworks.
Strategic Benefits:
Compliance Alignment: Supports both GHG Protocol and ISO methodologies for international reporting.
Data Transparency: Maintains consistent mapping between calculation results and analytical visualization.
Operational Insight: Helps organizations identify which processes, facilities, or sources drive the majority of emissions.
Benchmarking & Targeting: Facilitates baseline establishment, progress tracking, and reduction planning.
Example Use Case:
A sustainability manager can analyze emissions by GHG scope for CDP disclosure, then switch to Source-Based view to identify operational inefficiencies in energy use or logistics — all from the same dataset.
4. Best Practices
Begin analysis in GHG-Based mode for compliance verification, then switch to Source-Based to identify operational drivers.
Use Facility Filters to compare performance across locations or business units.
Combine Donut Chart visuals with table data for board presentations and KPI dashboards.
Regularly export segmented data to support internal performance reviews and external assurance reports.
Leverage ISO-Based analysis when aligning with corporate ESG frameworks or third-party audits.